
CIO Viewpoint: Have We Reached the Bottom of the Bear Market?
Author: Yao Wang | Editor: Nicolas Sioné

The US inflation has been stickier than expected. The hawkish September Fed meeting statement verified the market’s concerns that the endpoint of the policy rate should be higher than previously expected.
The surging inflation and the hawkish rate hikes from central banks have pushed most global equity markets into bear territory (down more than 20%). The S&P 500 Index dropped 24% from the high in January to the low in June. Although the Index had a decent 2-month rally of 17%, it resumed the downward trend and dipped slightly below the June low as of September 27th.
We are already in a bear market. However, the question is: Have we reached the bottom? If not, where does it lie?
In this letter, we try to address these questions based on evidence collected from past bear markets. Although history does not necessarily repeat itself, we hope that previous experiences combined with our analysis can inspire some of our readers.
Why are we still in a bear market, and not at the early stage of a bull market?
To answer the question of whether we have reached the bottom, we look at the US bear markets since 1970.
There have been seven bear markets since then, including the current one. We did not include the end of the 1968-1970 bear market as we only considered full bear markets during this period.
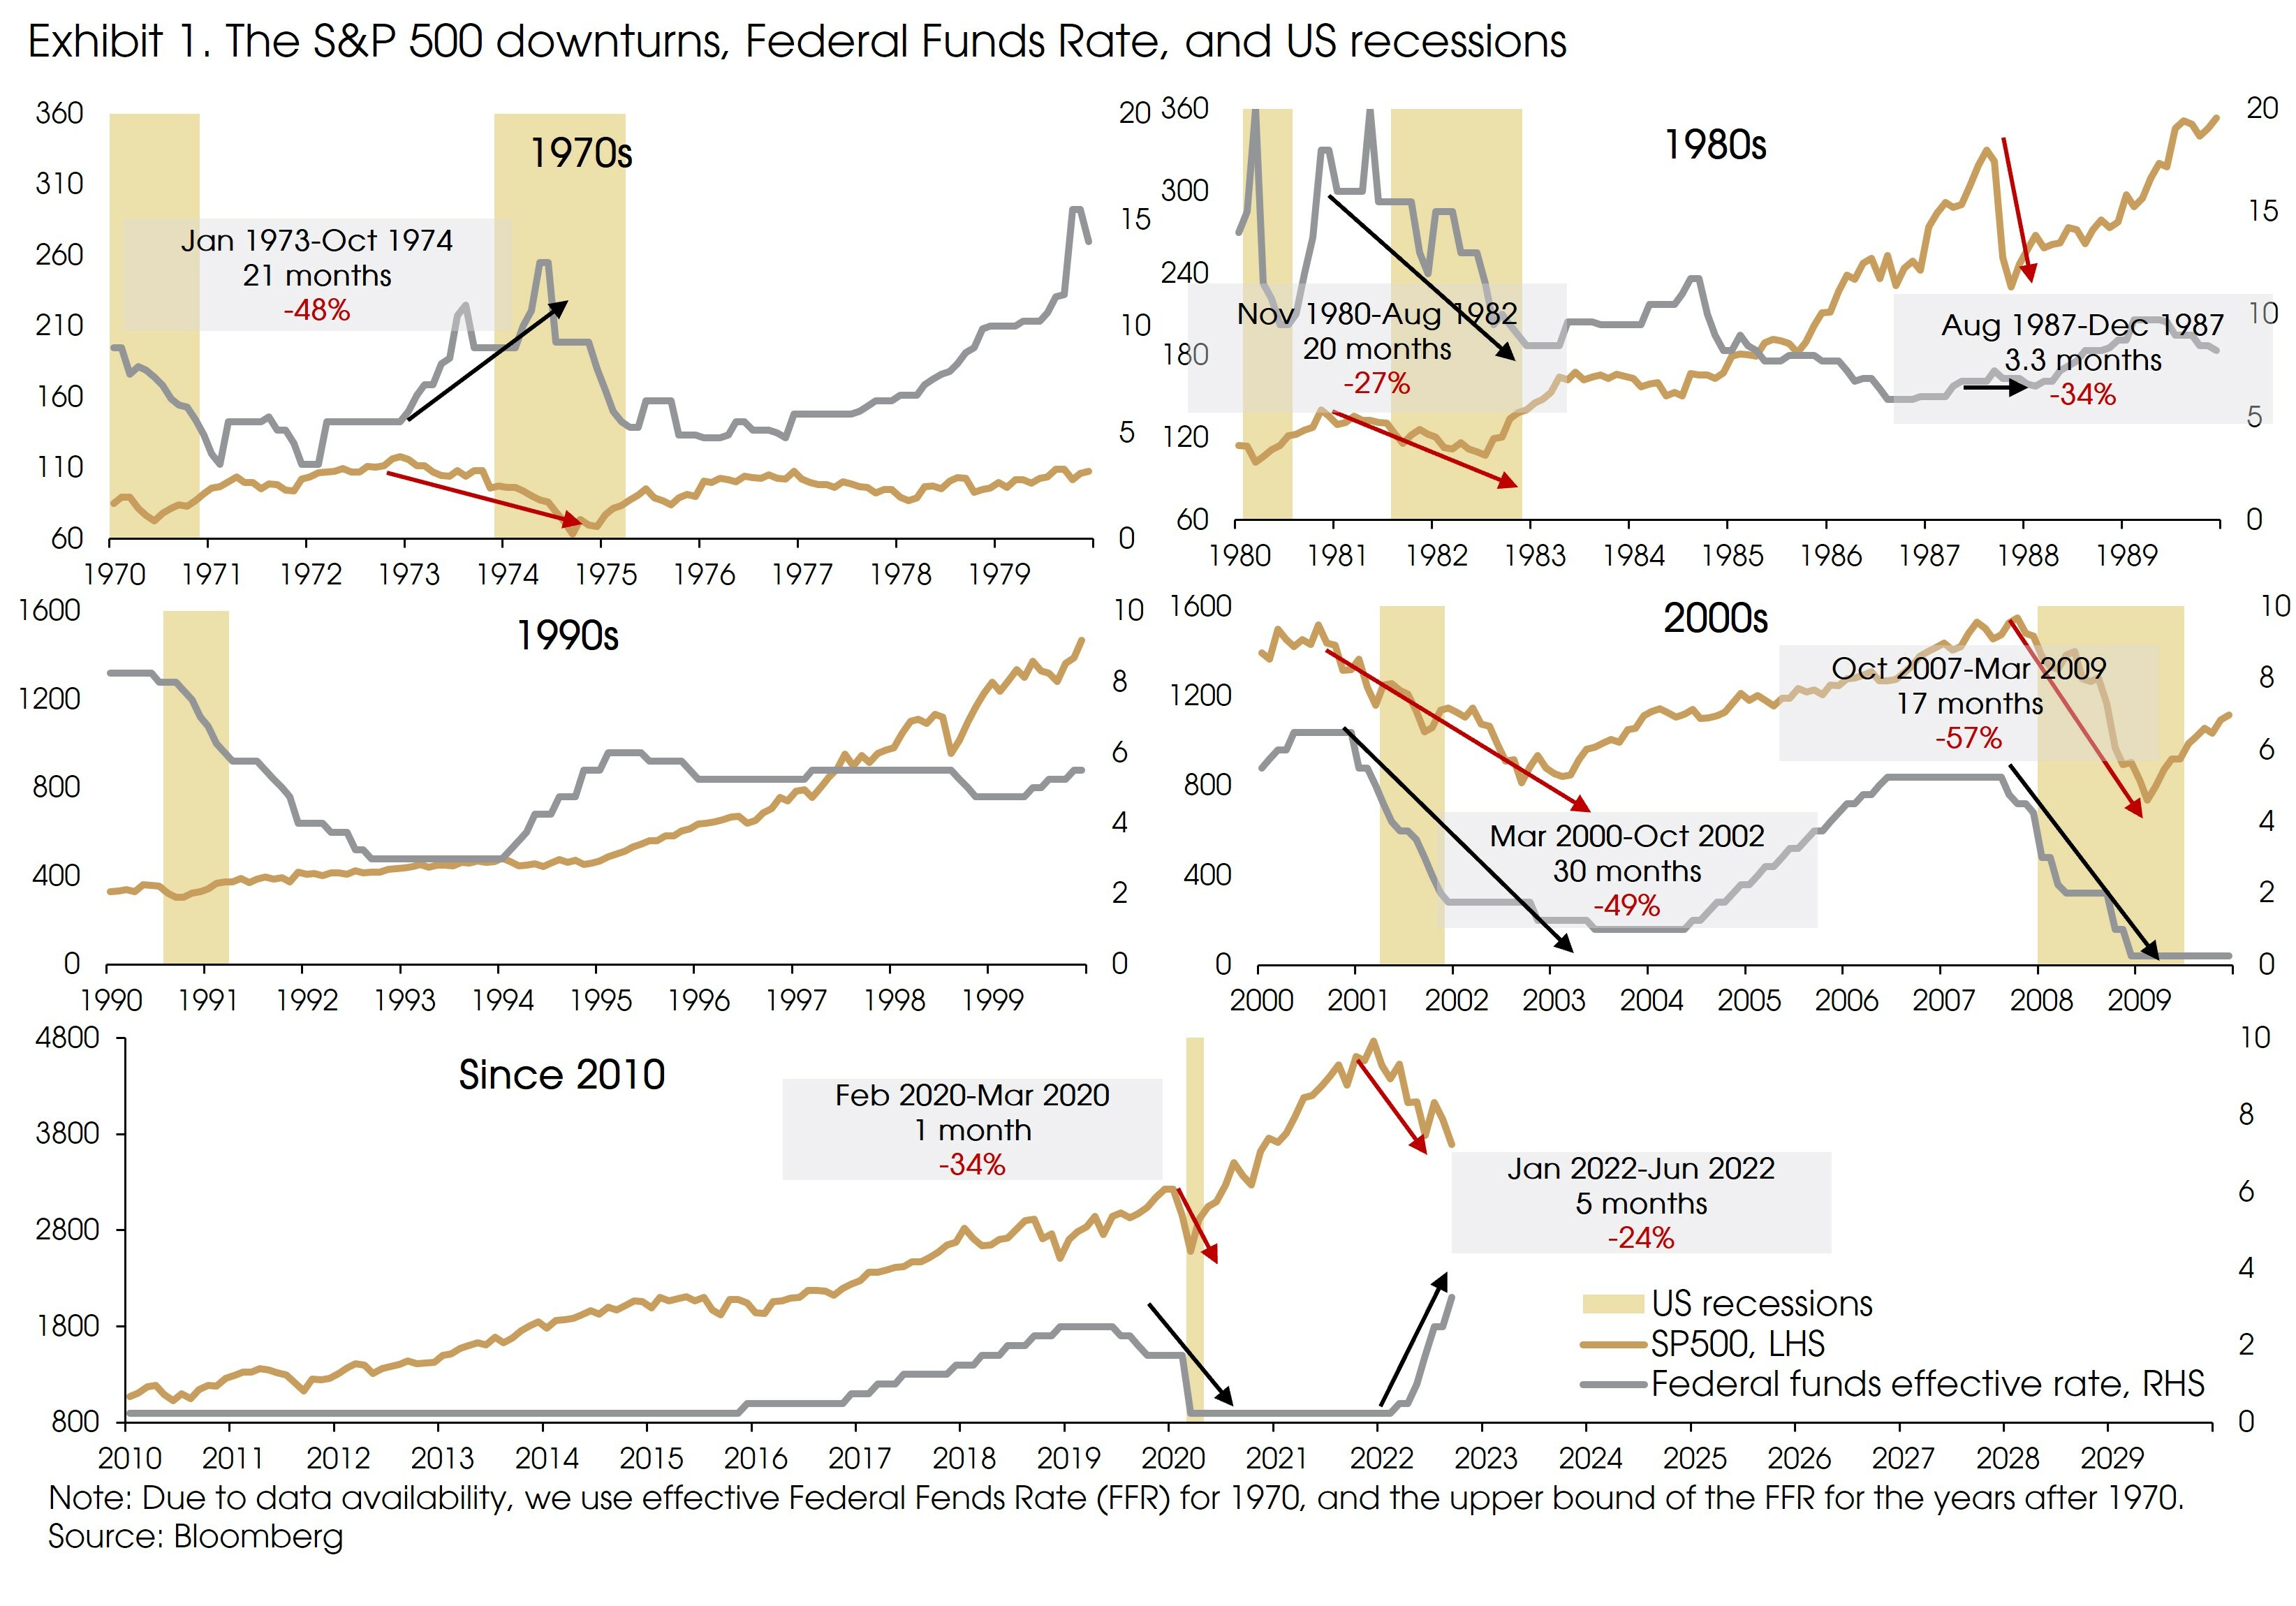
History shows that most bear markets have been related to rate hike cycles: Some happened during rate hike cycles (e.g., in 1973-74 and the current one), and others happened after the rate hike cycle. Meanwhile, most previous bear markets ended during or after economic recessions and after the Fed had cut the rate.
The only exception was the 1987 bear market, which was unrelated to any fundamental economic changes or a rate hike cycle. The ’87 market downturn was mainly due to the deteriorated sentiment and investor herd behavior. This is not the case for the current bear market.
Excluding the 1987 episode, it seems that for a bear market to end, we need economic downturns and/or rate cuts from the Fed.
Market returns are counter-cyclical. Equity markets tend to do better when growth is very weak but improving, rather than when it is strong but slowing. Equity returns are high when the economy bottoms out from the trough, while the weakest returns happen when the economy slows from peak towards contraction.
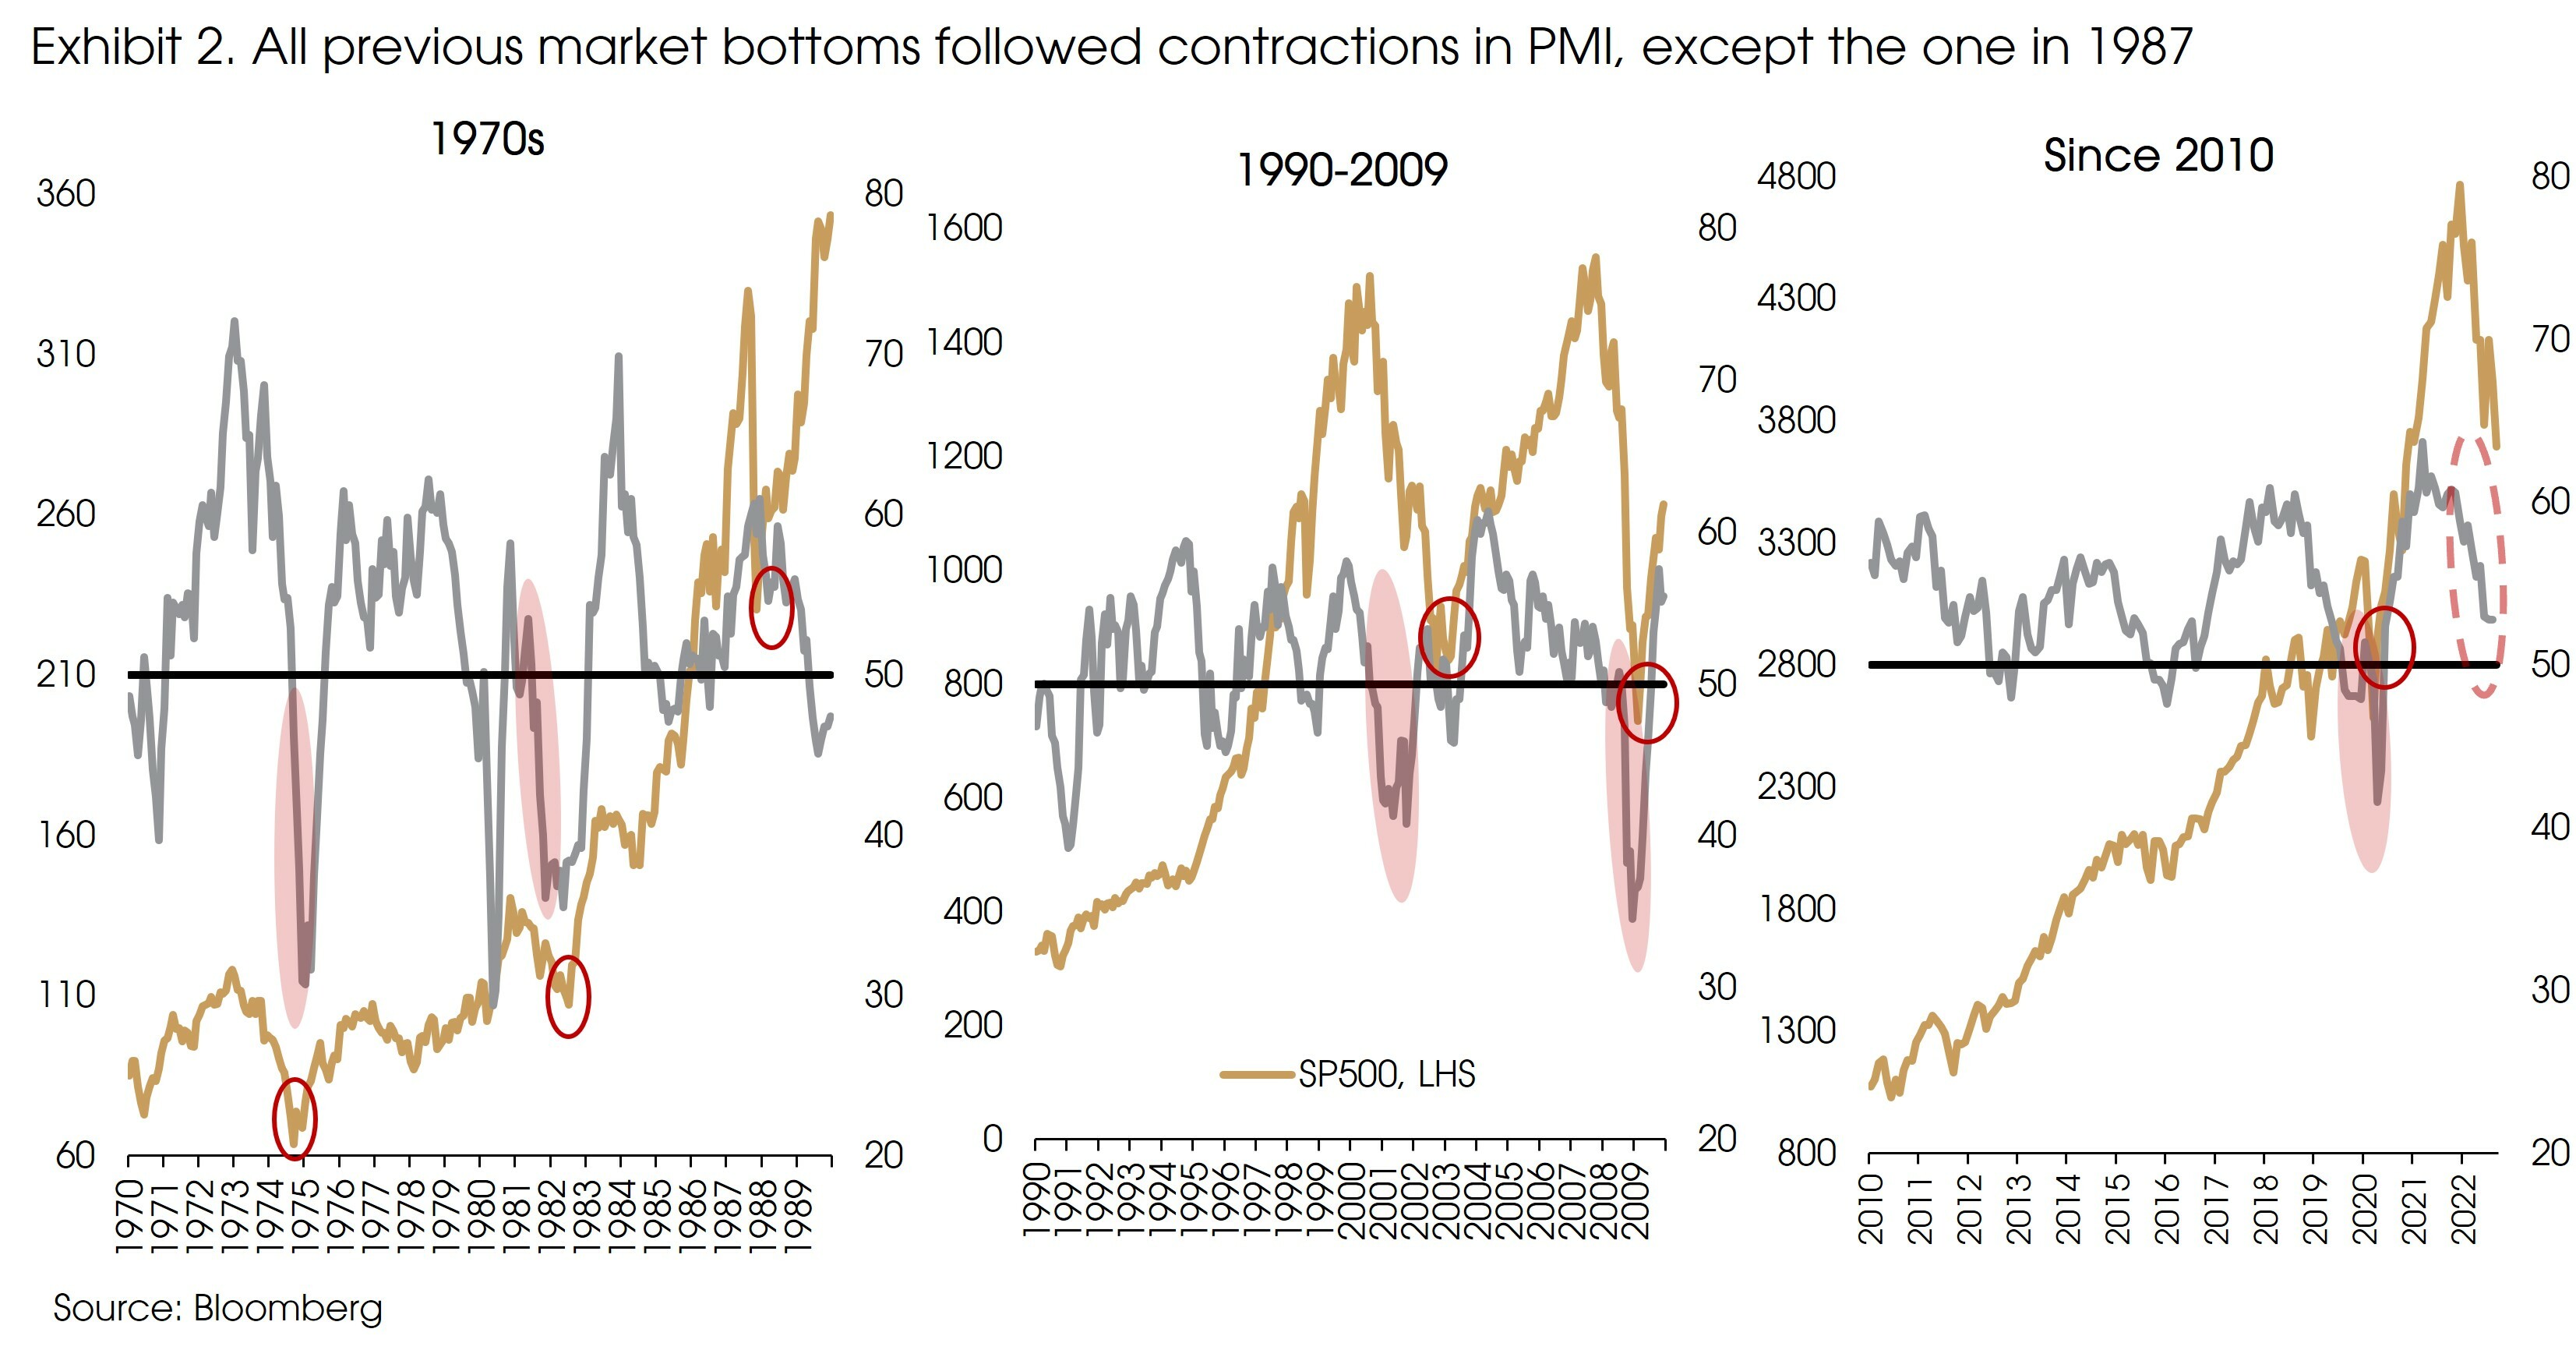
According to Goldman Sachs, since 1980, the average monthly return of the S&P 500 Index was 1.6% when the PMI rose from the bottom to 50 (the threshold between contraction (sub-50) and expansion (above-50)). However, when the PMI increased from 50 to the peak, the average monthly return declined to 1.2%. The average return fell sharply to -0.4% when the PMI dipped from 50 to the bottom.
In previous bear markets, the emergence of a bull trend was usually identified after the PMI had bottomed and started to improve, once again except for the 1987 sentiment-driven bear market.
In line with this pattern, corporate earnings also tend to decline significantly before market bottoms. Due to data availability, we can only find forward EPS after 1990, while for the period before 1990, only trailing EPS is available (a lagging indicator of current corporate earnings).
For the most recent three bear markets since 1990, forward EPS declined by -17% before the market bottom in 2002, plunged -37% before the bottom in 2009, and dropped -14% during the one-month bear market in 2020.
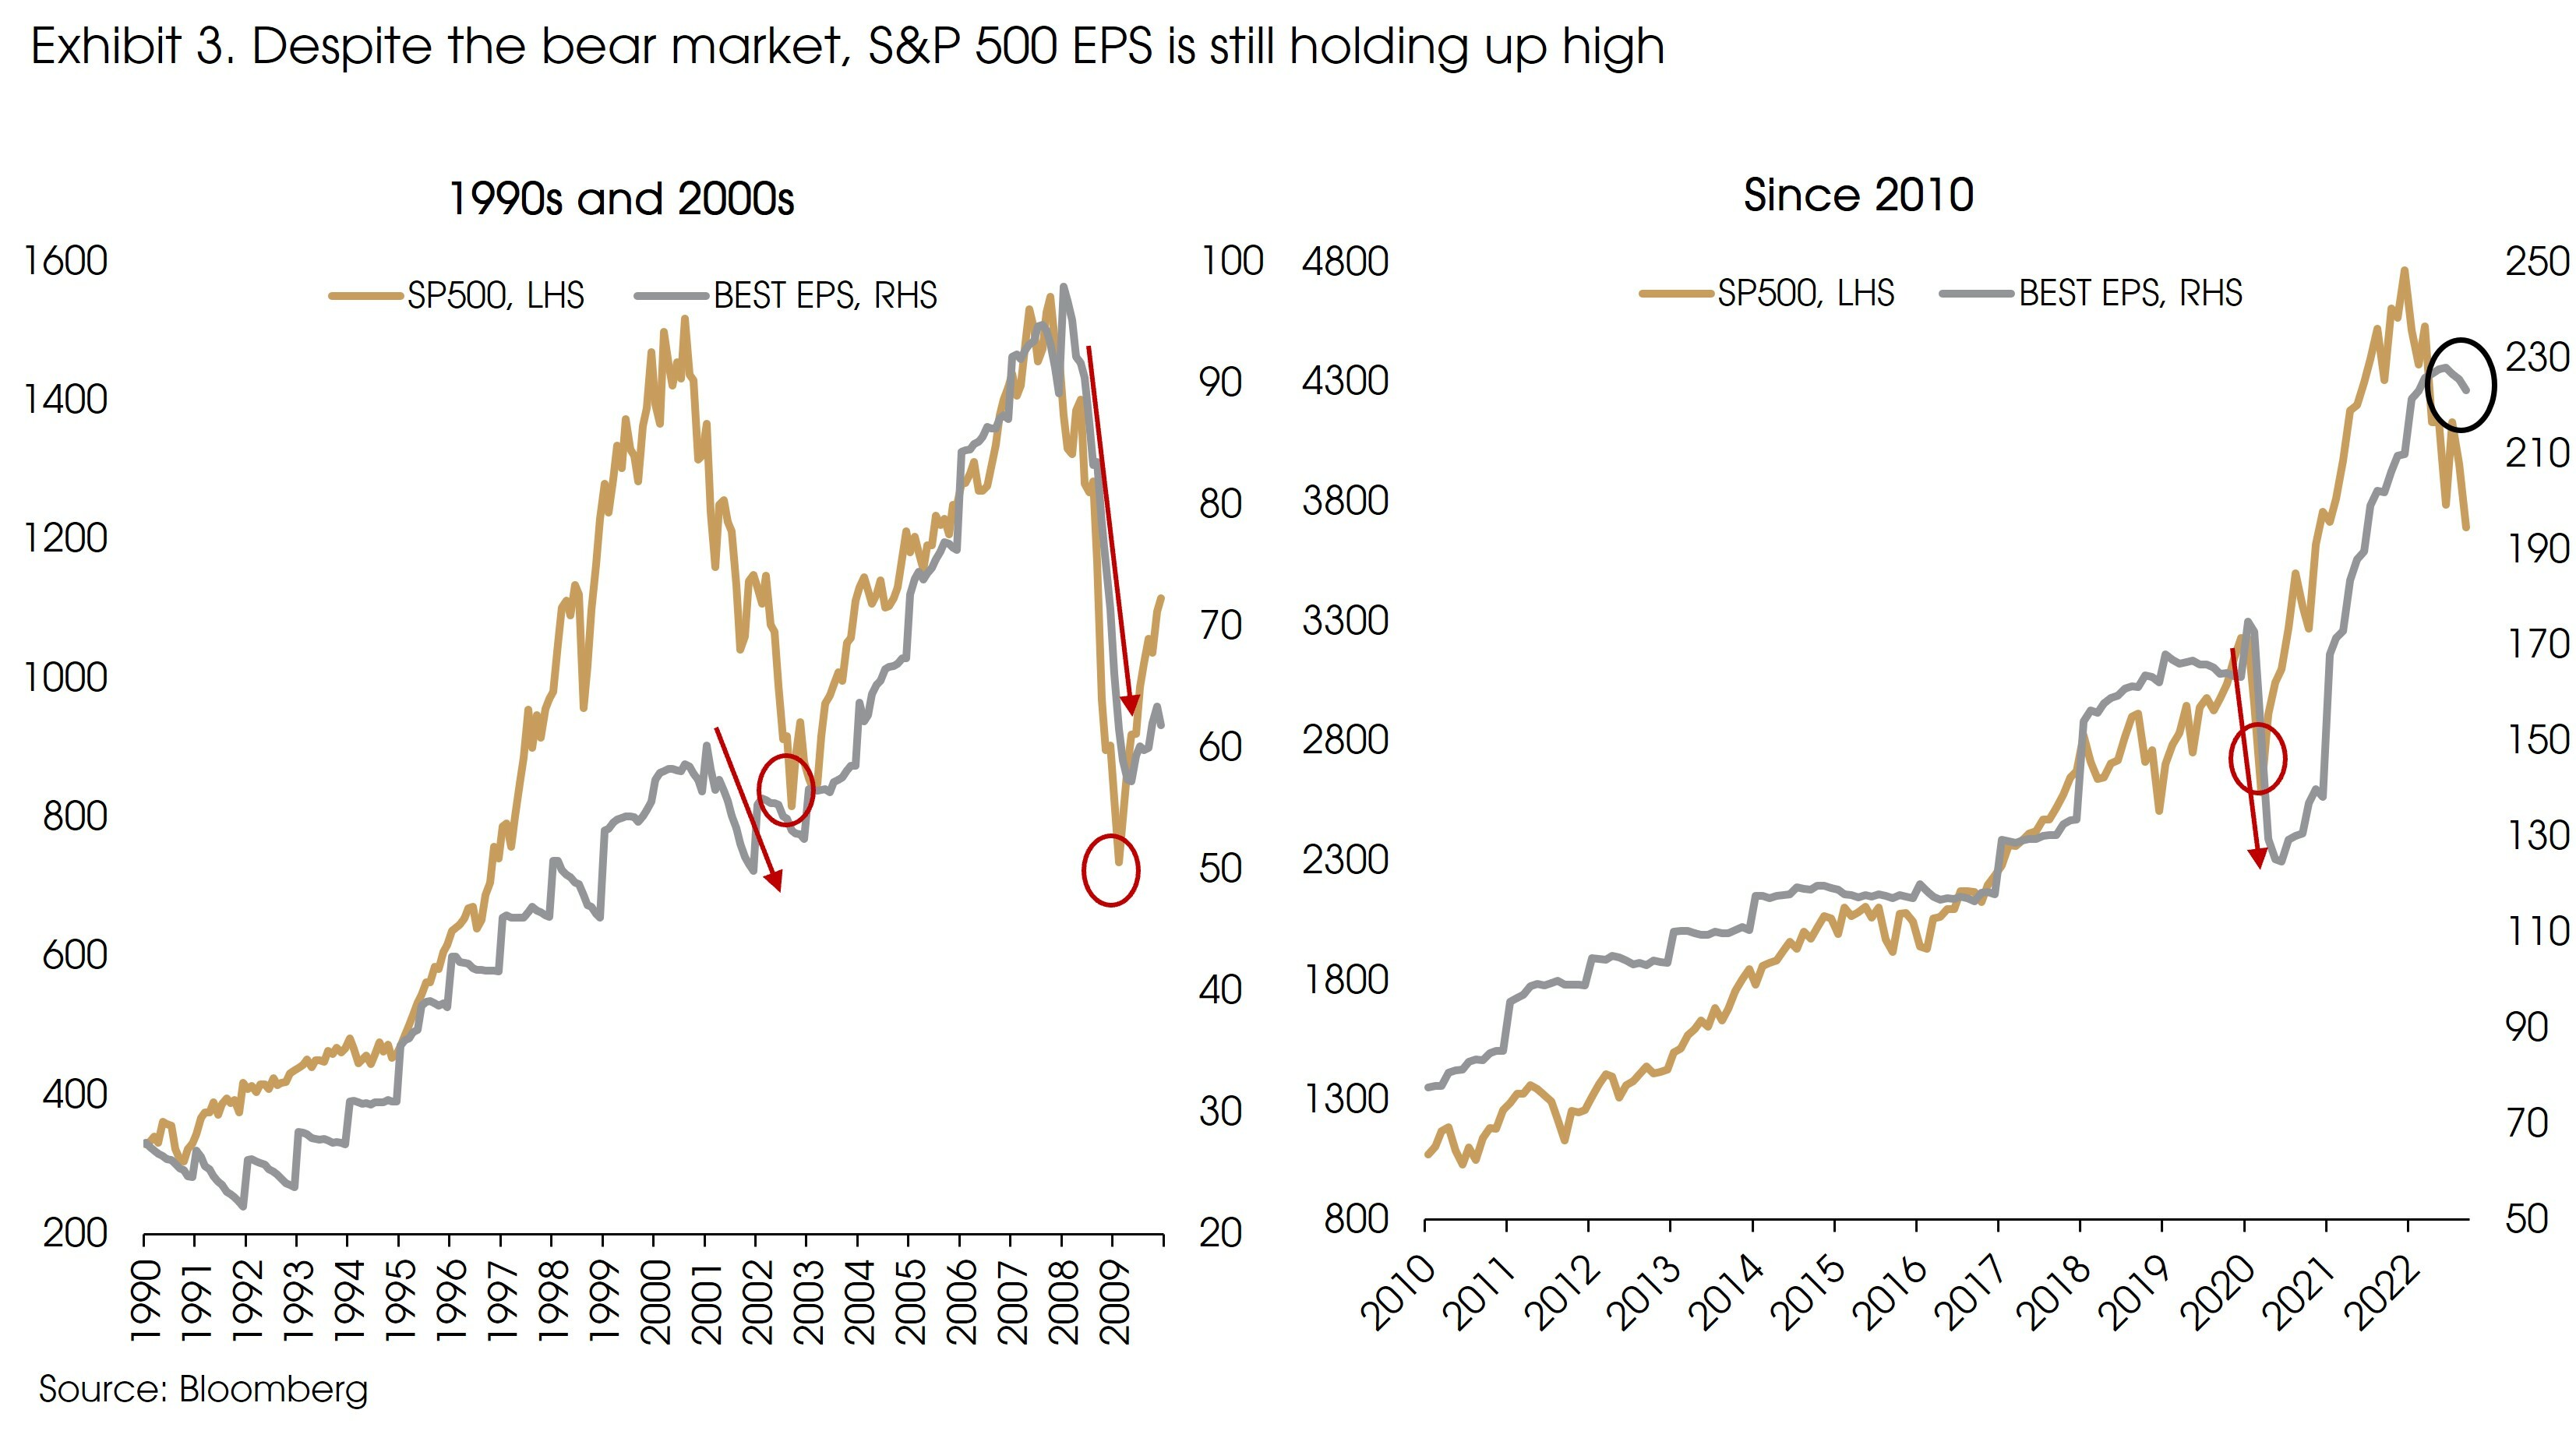
To clarify, we do not need to wait for corporate earnings to bottom to call the end of a bear market. For example, earnings fell for another three months after the market reached the bottom in 2002 and 2020.
Nonetheless, current EPS are still near all-time highs, the PMI stays well above 50, and the Fed is determined to continue fighting inflation by hiking rates. Previous experiences suggest that bear markets usually do not end in such a combination of economic and monetary policy conditions.
Will the peak of the Fed tightening end the bear market?
Some market views suggest that a bear market may end around the peak of monetary tightening, if a soft-landing is achieved. Such expectation has fuelled the market rally from June to August, as investors became increasingly confident that the peak in the rate hike cycle was being reached.
Such optimism in the market soon proved wrong as published inflation data continued its progression, combined with an increased hawkishness from the Fed.
That said, after hiking the rate by 300 bps already and with the moderating signs in inflation, the Fed will probably switch to smaller rate hikes towards the end of this year. Will that suggest a bottom in the market?
We think that the answer should be no.
Indeed, if the Fed shifts to smaller hikes, the expectations of a potential ‘Fed Pivot’ could be a powerful trigger a strong market rebound, particularly in the absence of any major recession.
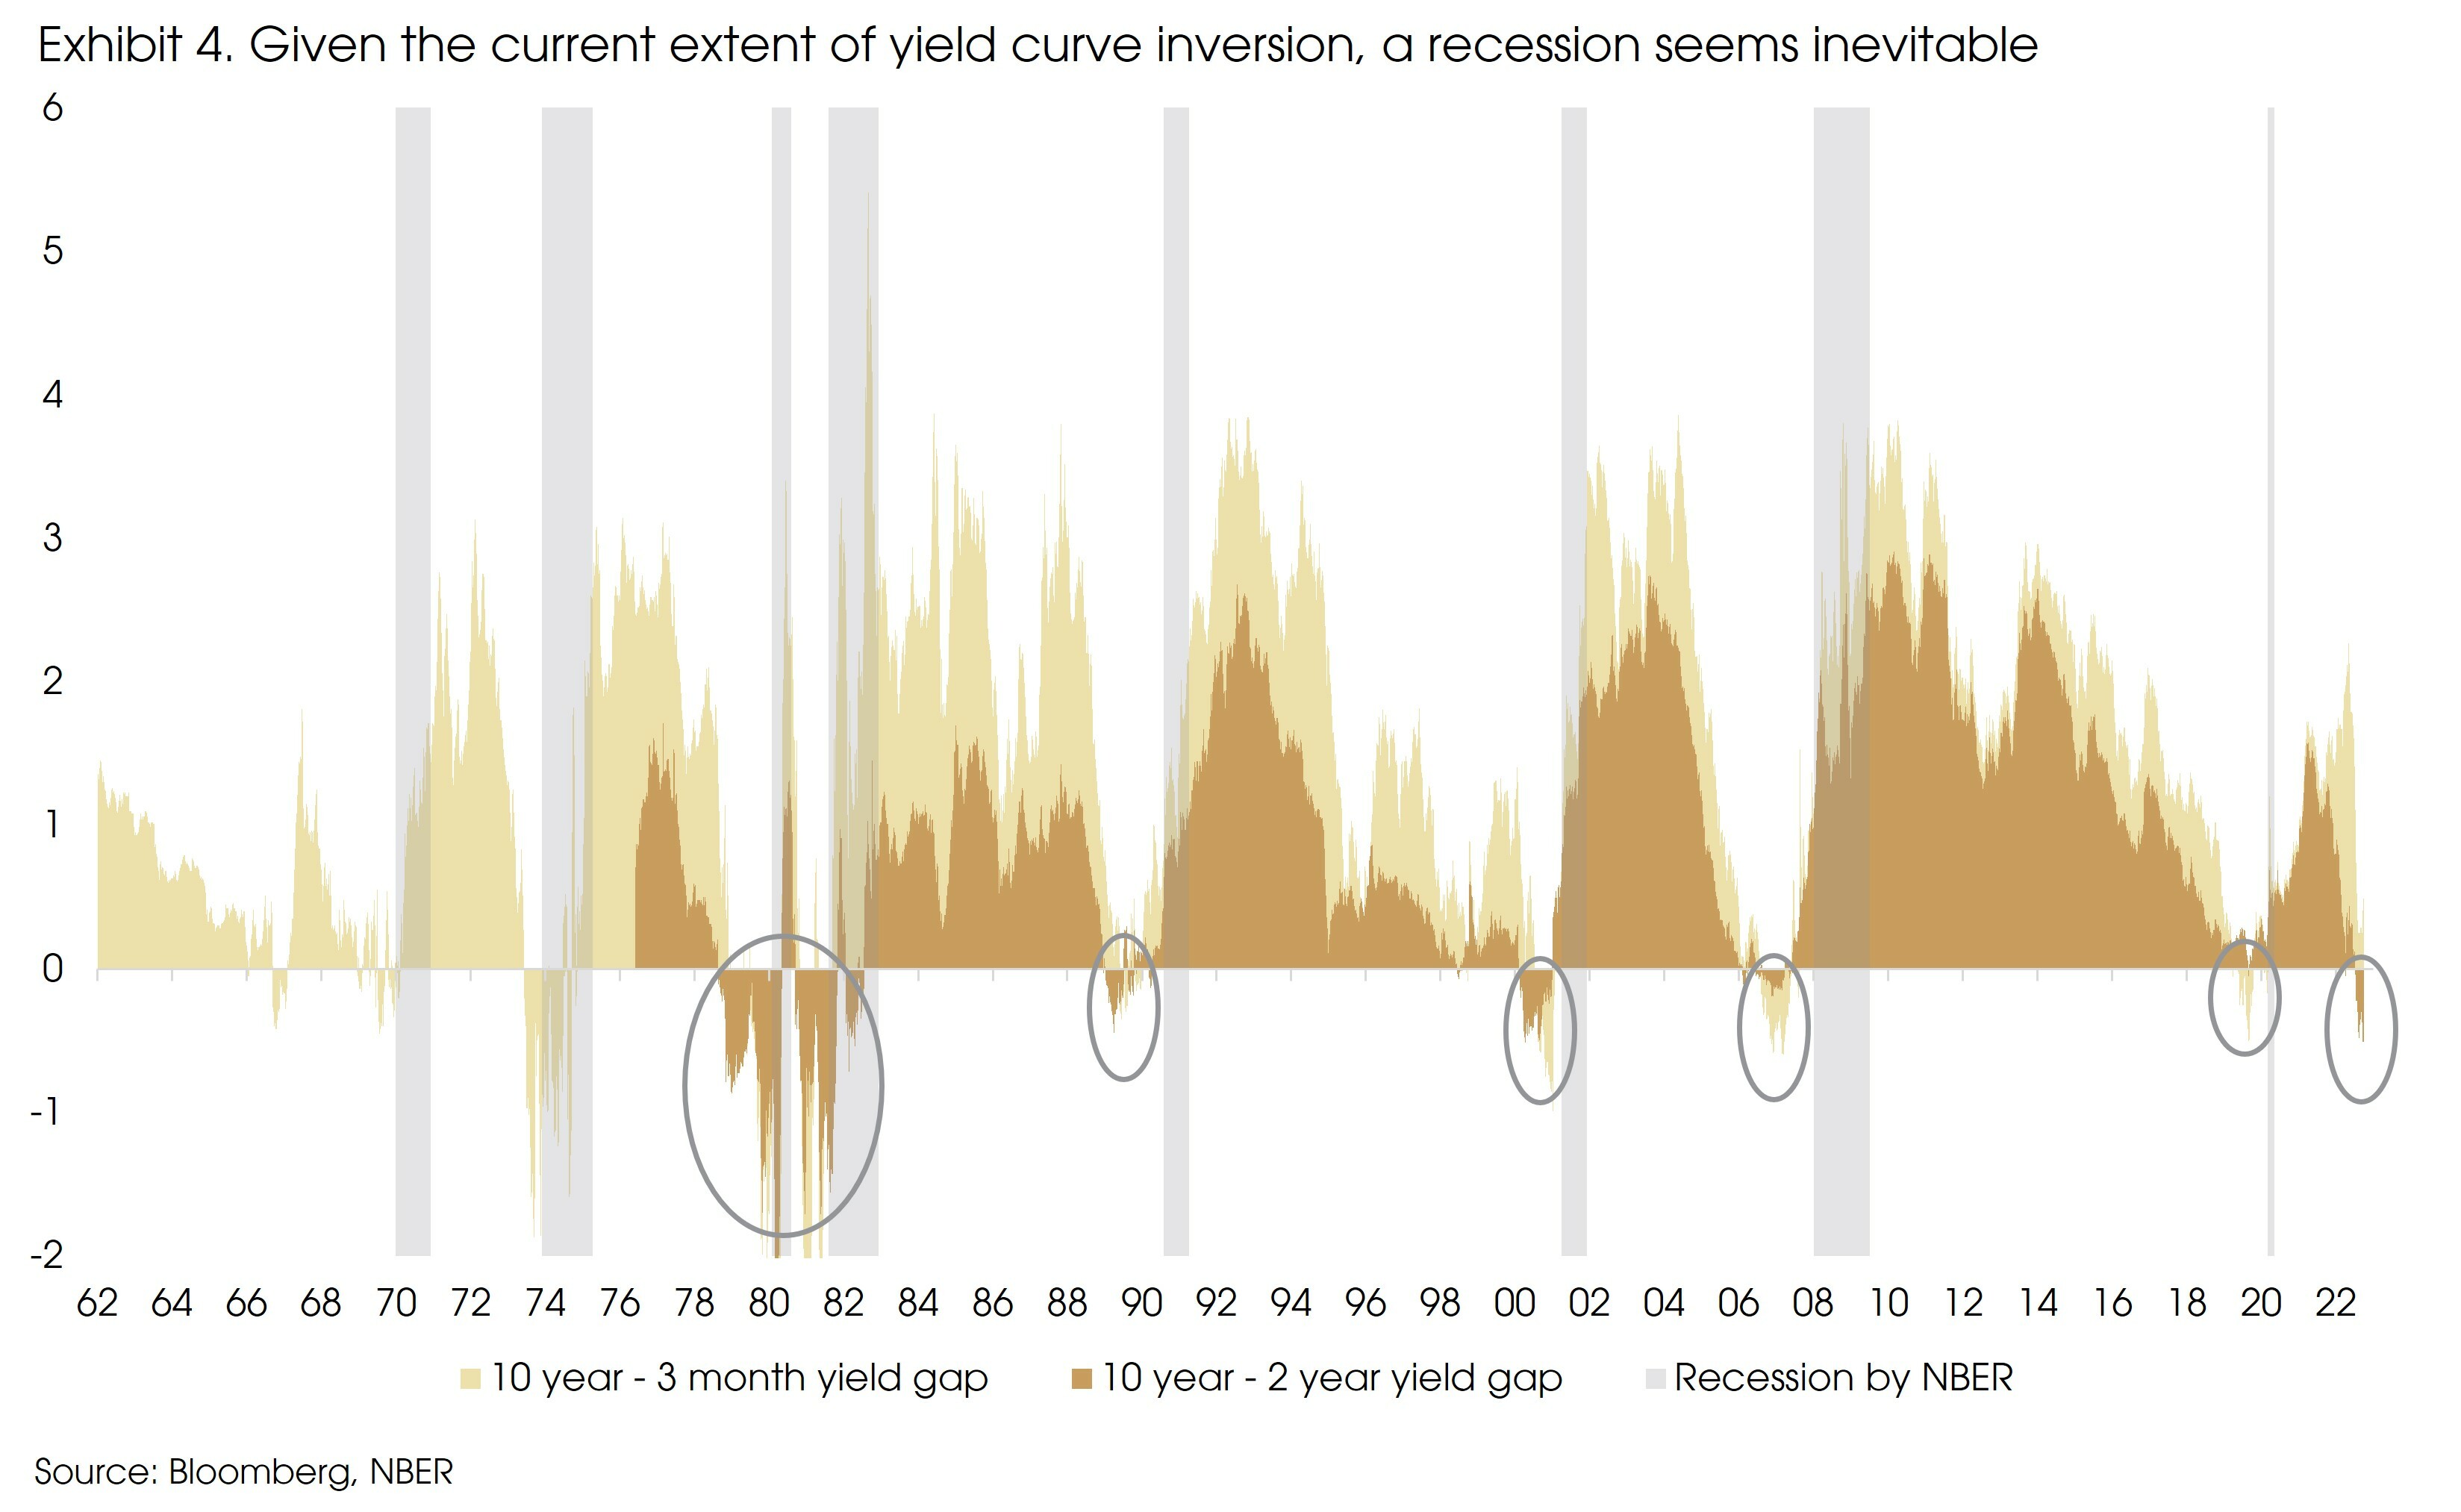
However, a recession may now be inevitable. We have mentioned before that the yield curve inversion has been a very accurate recession indicator (see “The Recession Playbook”). Seen from the current extent of yield curve inversion, a recession is highly likely.
During the past decade or two, bad news was good news, as central banks always turned dovish whenever the economy sent signals of slowdown.
However, such a dynamic between central bank policy and economic conditions only holds after Paul Volcker shifted the economy out of “great inflation” and into “great moderation”, where inflation was no longer a concern.
Given the current decades-high inflation, central banks have to prioritize containing inflation to restore their credibility. After all, the inflation target is written in central banks’ statements, but they have never mentioned maintaining a “positive” or “2%” GDP growth.
Such a change in policy focus can be seen from the recent Fed actions and statements, which abandoned “gradualism” in rate hikes, and signaled that the Fed is “strongly committed” to bringing inflation back to 2% over time, even at the cost of economic growth.
Given the almost inevitable recession and the Fed’s changing mindset, the central bank will probably continue hiking well into a recession, as was done in the 1970s and 80s.
In the 1973-74 bear market, the Fed continued to hike after the GDP growth turned negative. The recession hit in December 1973, but the Fed continued hiking by another four ppts and only stopped in May 1974. In July 1974, the central bank started cutting the rate and the market bottomed after three months in October.
Therefore, it is likely that we will see a deteriorated economy in the coming quarters. However, the Fed may not shift as swiftly as it usually does.
Switching to smaller rate hikes may not be enough to end the bear market. Signals of rate cuts are needed as the “official evidence” that inflation is under control, as was the case in 1973-74.
What could be the signals for inflections points
Peaking or moderated inflation will certainly be perceived as good news by the market. We expect inflation to come down in 4Q 2022, given the high base from last year and continued supply chain improvements.
That said, peaking inflation is unnecessary nor sufficient for a market bottom. During the 1973-1974 bear market, inflation peaked two months after the market bottom, while during the 1981-1982 bear market, the market continued to decline for eight months after the peak in inflation.
One needs to keep in mind that inflation is not a direct influencer in the market, central bank policy is.
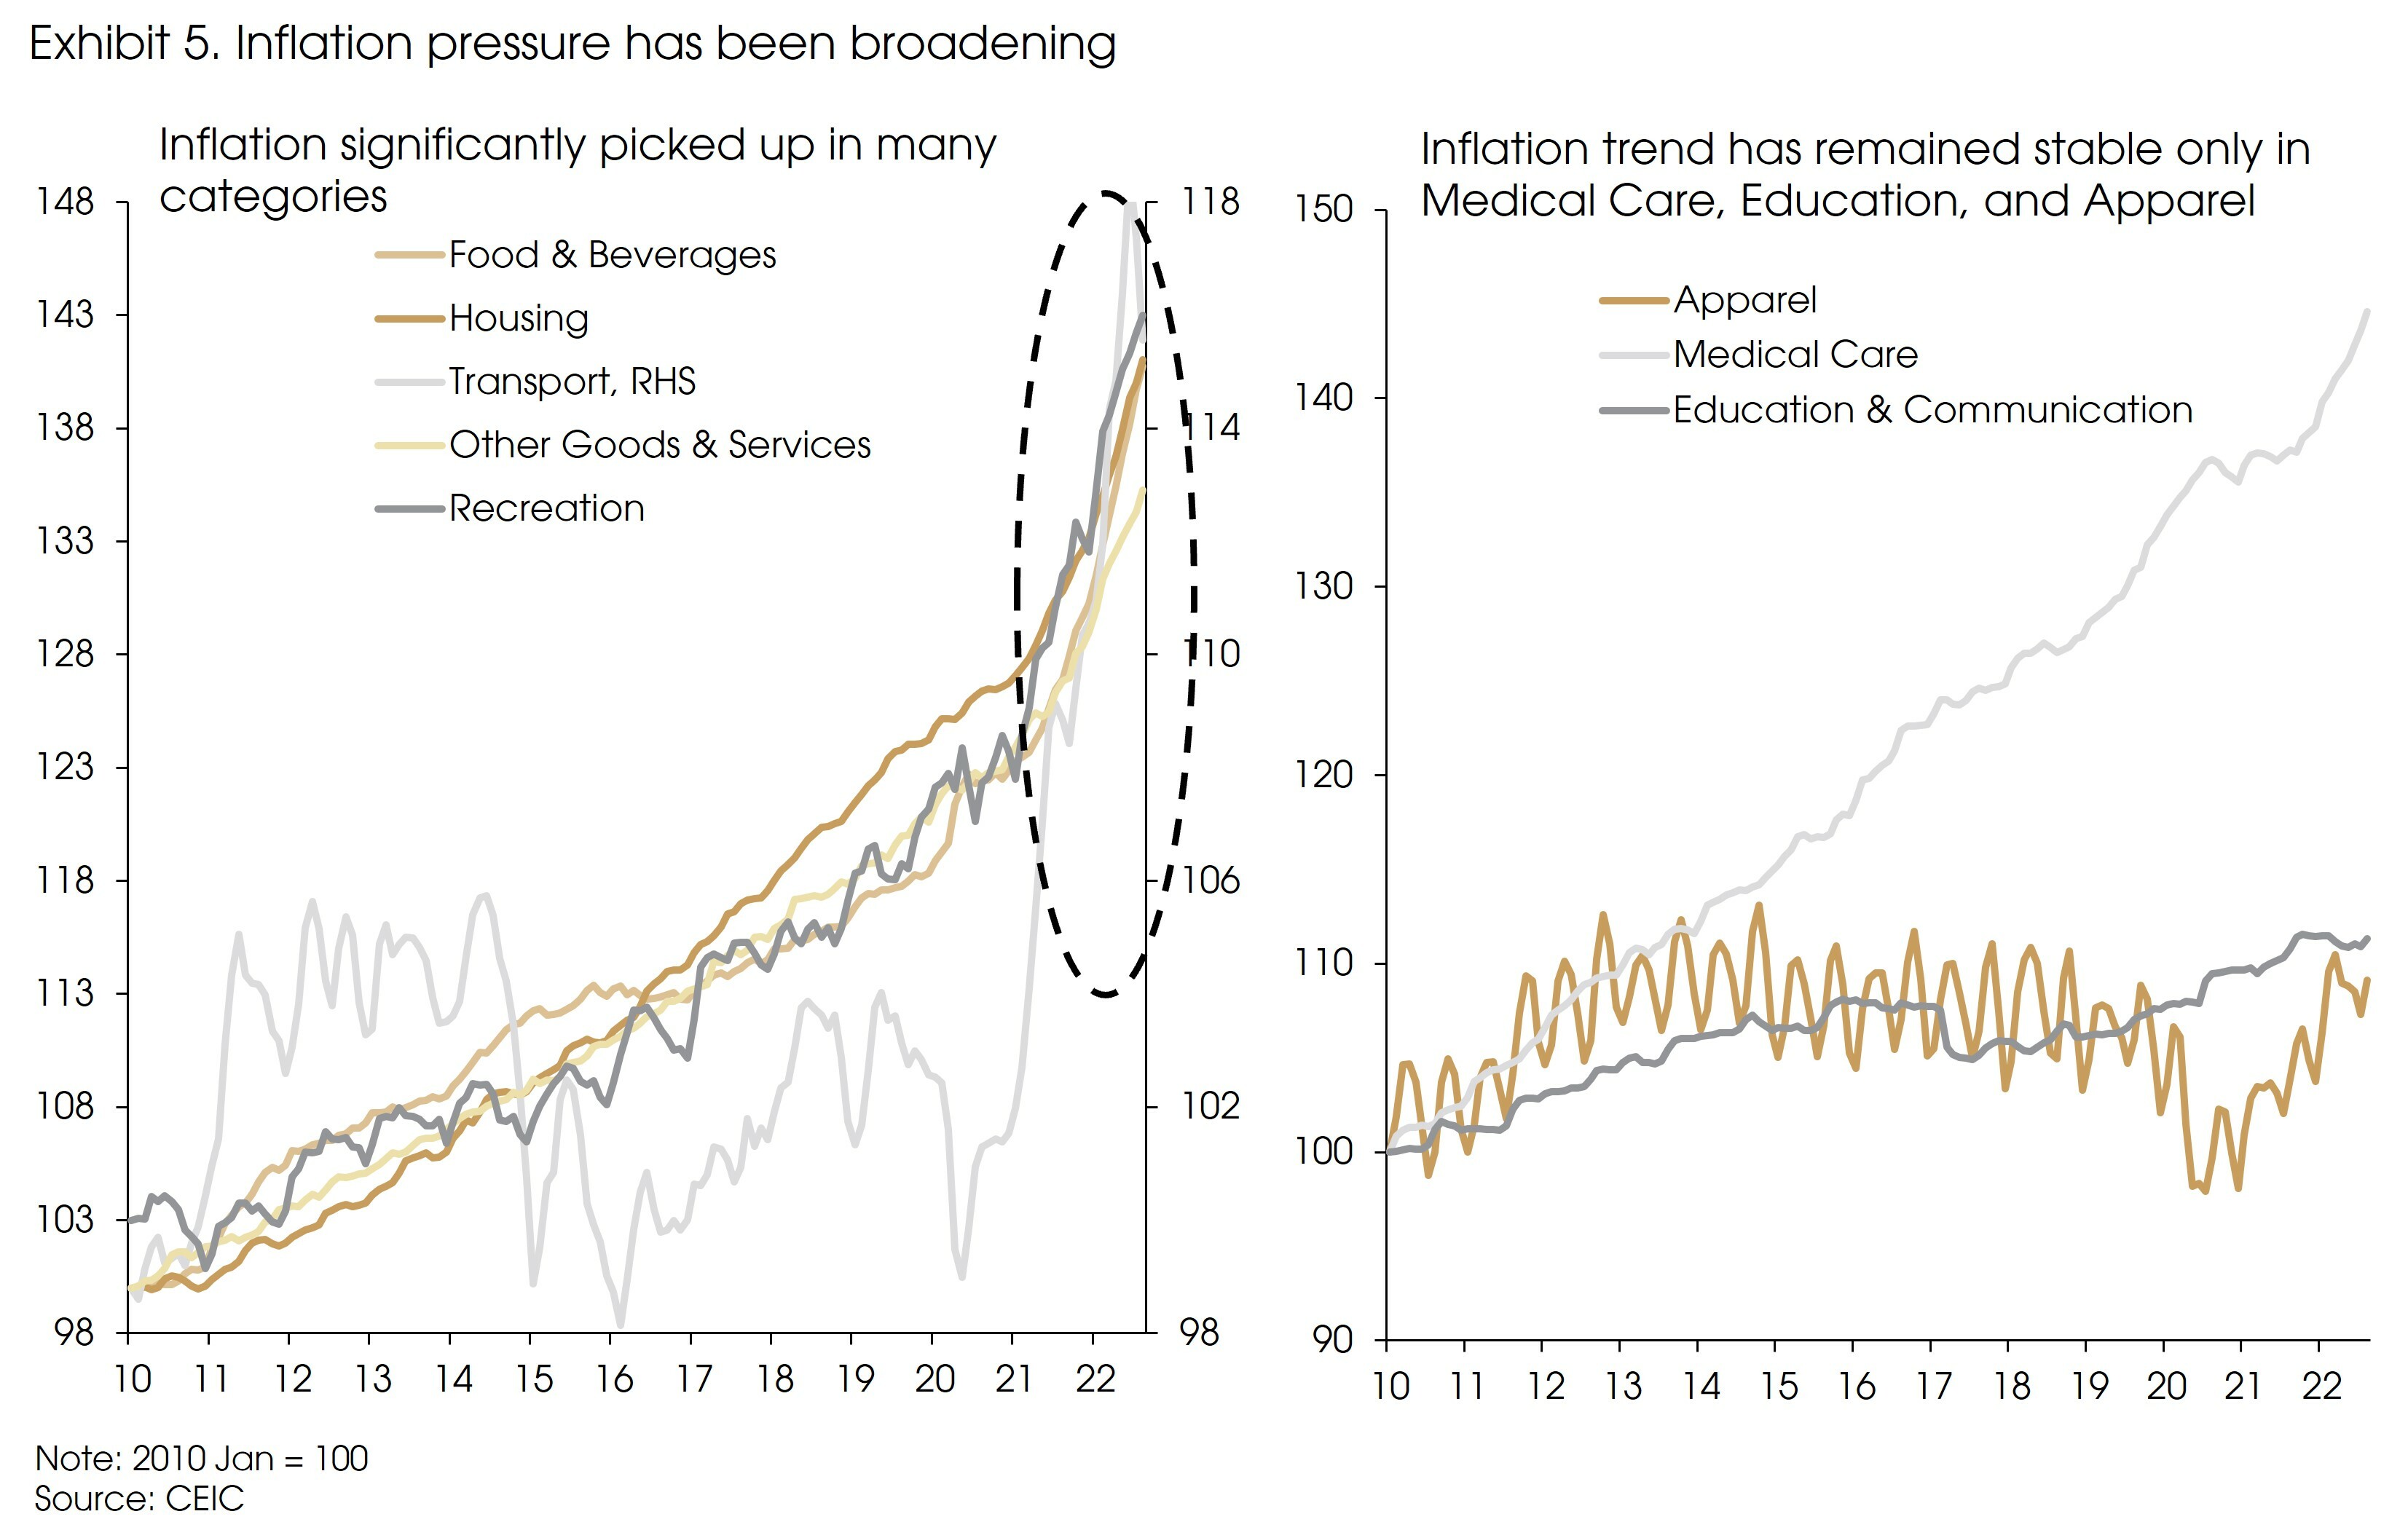
Current moderation in inflation has been driven by supply-side improvements in the US, such as energy and used cars and trucks. However, inflation pressure has broadened: Price levels in other categories, especially services, continued to rise at a higher pace than the pre-pandemic trend (Exhibit 5).
Given the change in central banks’ mindset (from supporting growth to containing inflation) and the broad-based pressure in price levels, the Fed may wait for more evidence that inflation will fall back towards 2% before pivoting.
Therefore, peaking inflation is a positive signal indeed, but not enough to call a market bottom. We still need to see clear signals of a policy shift from the Fed.
At what level are we confident to call a market bottom?
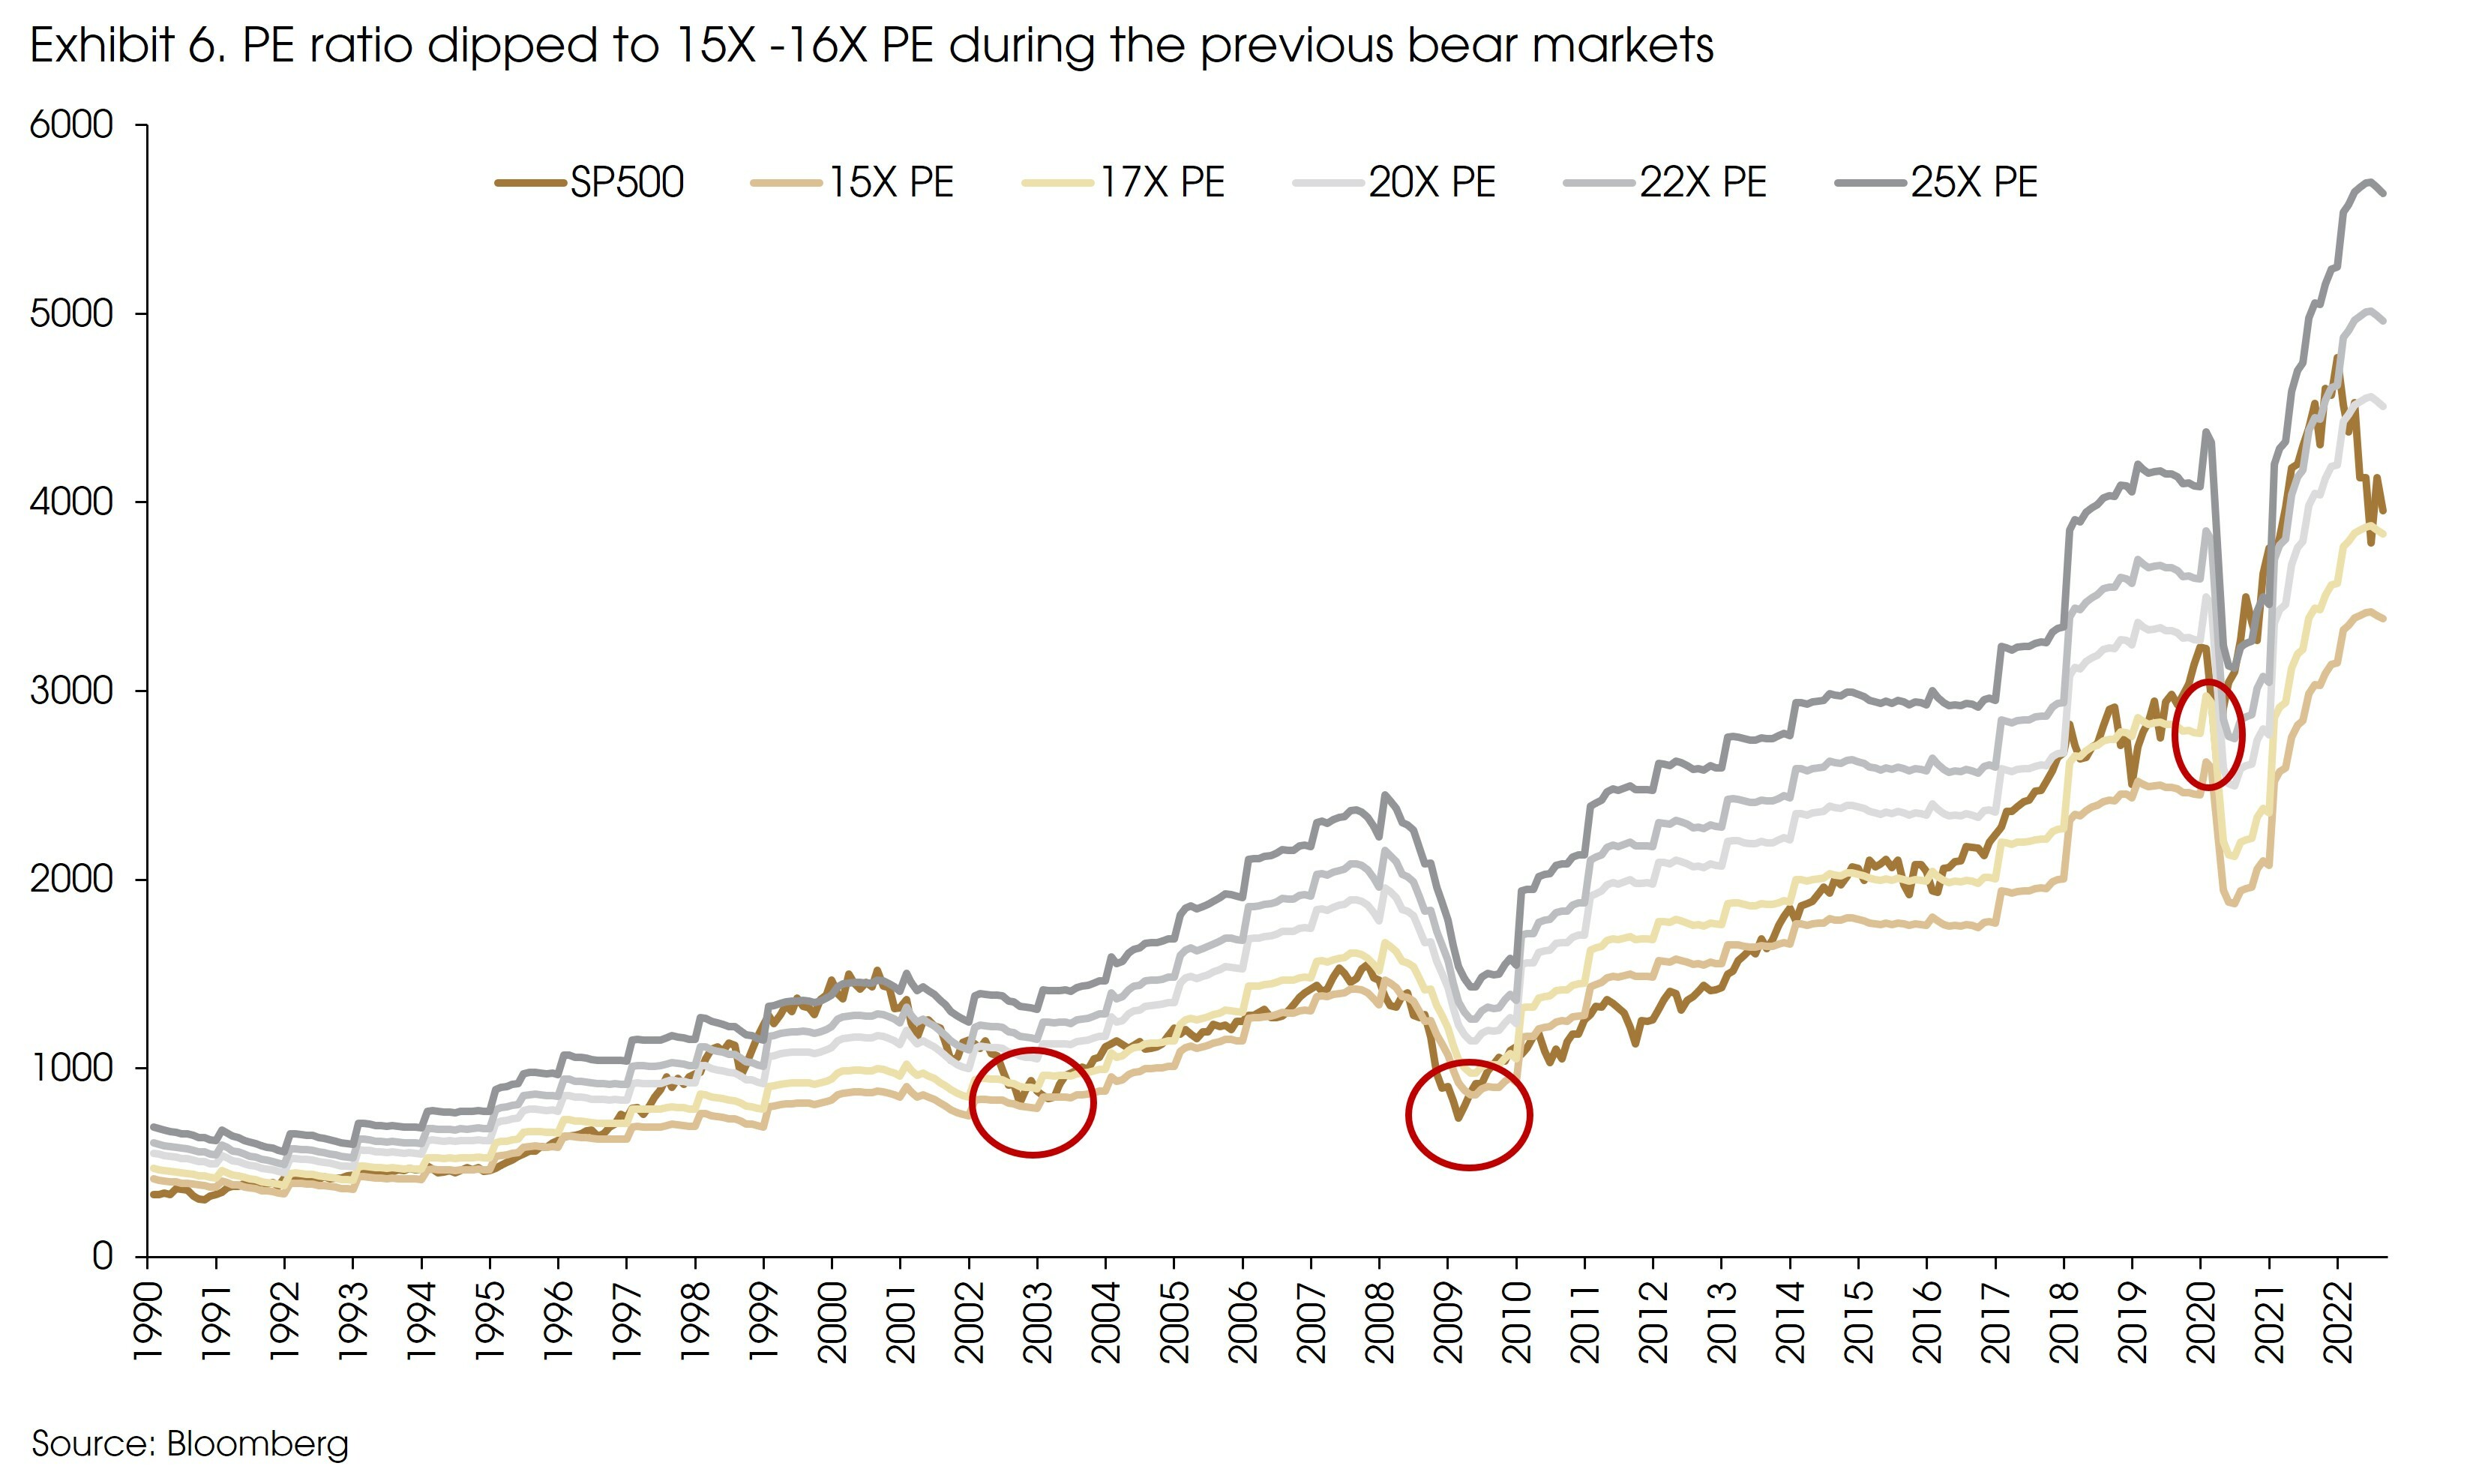
Although the current valuation of the S&P 500 has already declined significantly from 22X forward PE to 17X, we do not expect to see a notable re-rating any time soon (Exhibit 6).
Historically, valuation had to reach the 15-16X level before a market bottom, even with the economy falling into recession and bond yields declining. Valuation moved lower with bond yields during recessions.
Therefore, the 3200-3400 level of the S&P 500 Index, which represents a 16-17X PE combined with a 10% drop in EPS, is a more comfortable level for us to make a bullish call.
The 3200-3400 range is also the two-month trading range before the pandemic and indicates a peak to trough decline of around 30% for the current bear market. A 30% drawdown is comparable to the average decline of cyclical bear markets since 1800, according to Goldman Sachs.
In sum, we might be near the bottom of the current bear market. However, based on historical data, we are more comfortable to call a market bottom if the Fed sends clear signals on rate cuts or should the S&P 500 Index reach the 3200-3400 level.
What could be the leaders in the next bull market?
While we believe equity markets have not yet reached a bottom, it is worthwhile thinking about some likely drivers or characteristics of the next cycle.
It is very hard to predict future trends. However, in regard to the next bull market, one thing is clear: We shall not see zero/negative interest rates as experienced in the previous bull market.
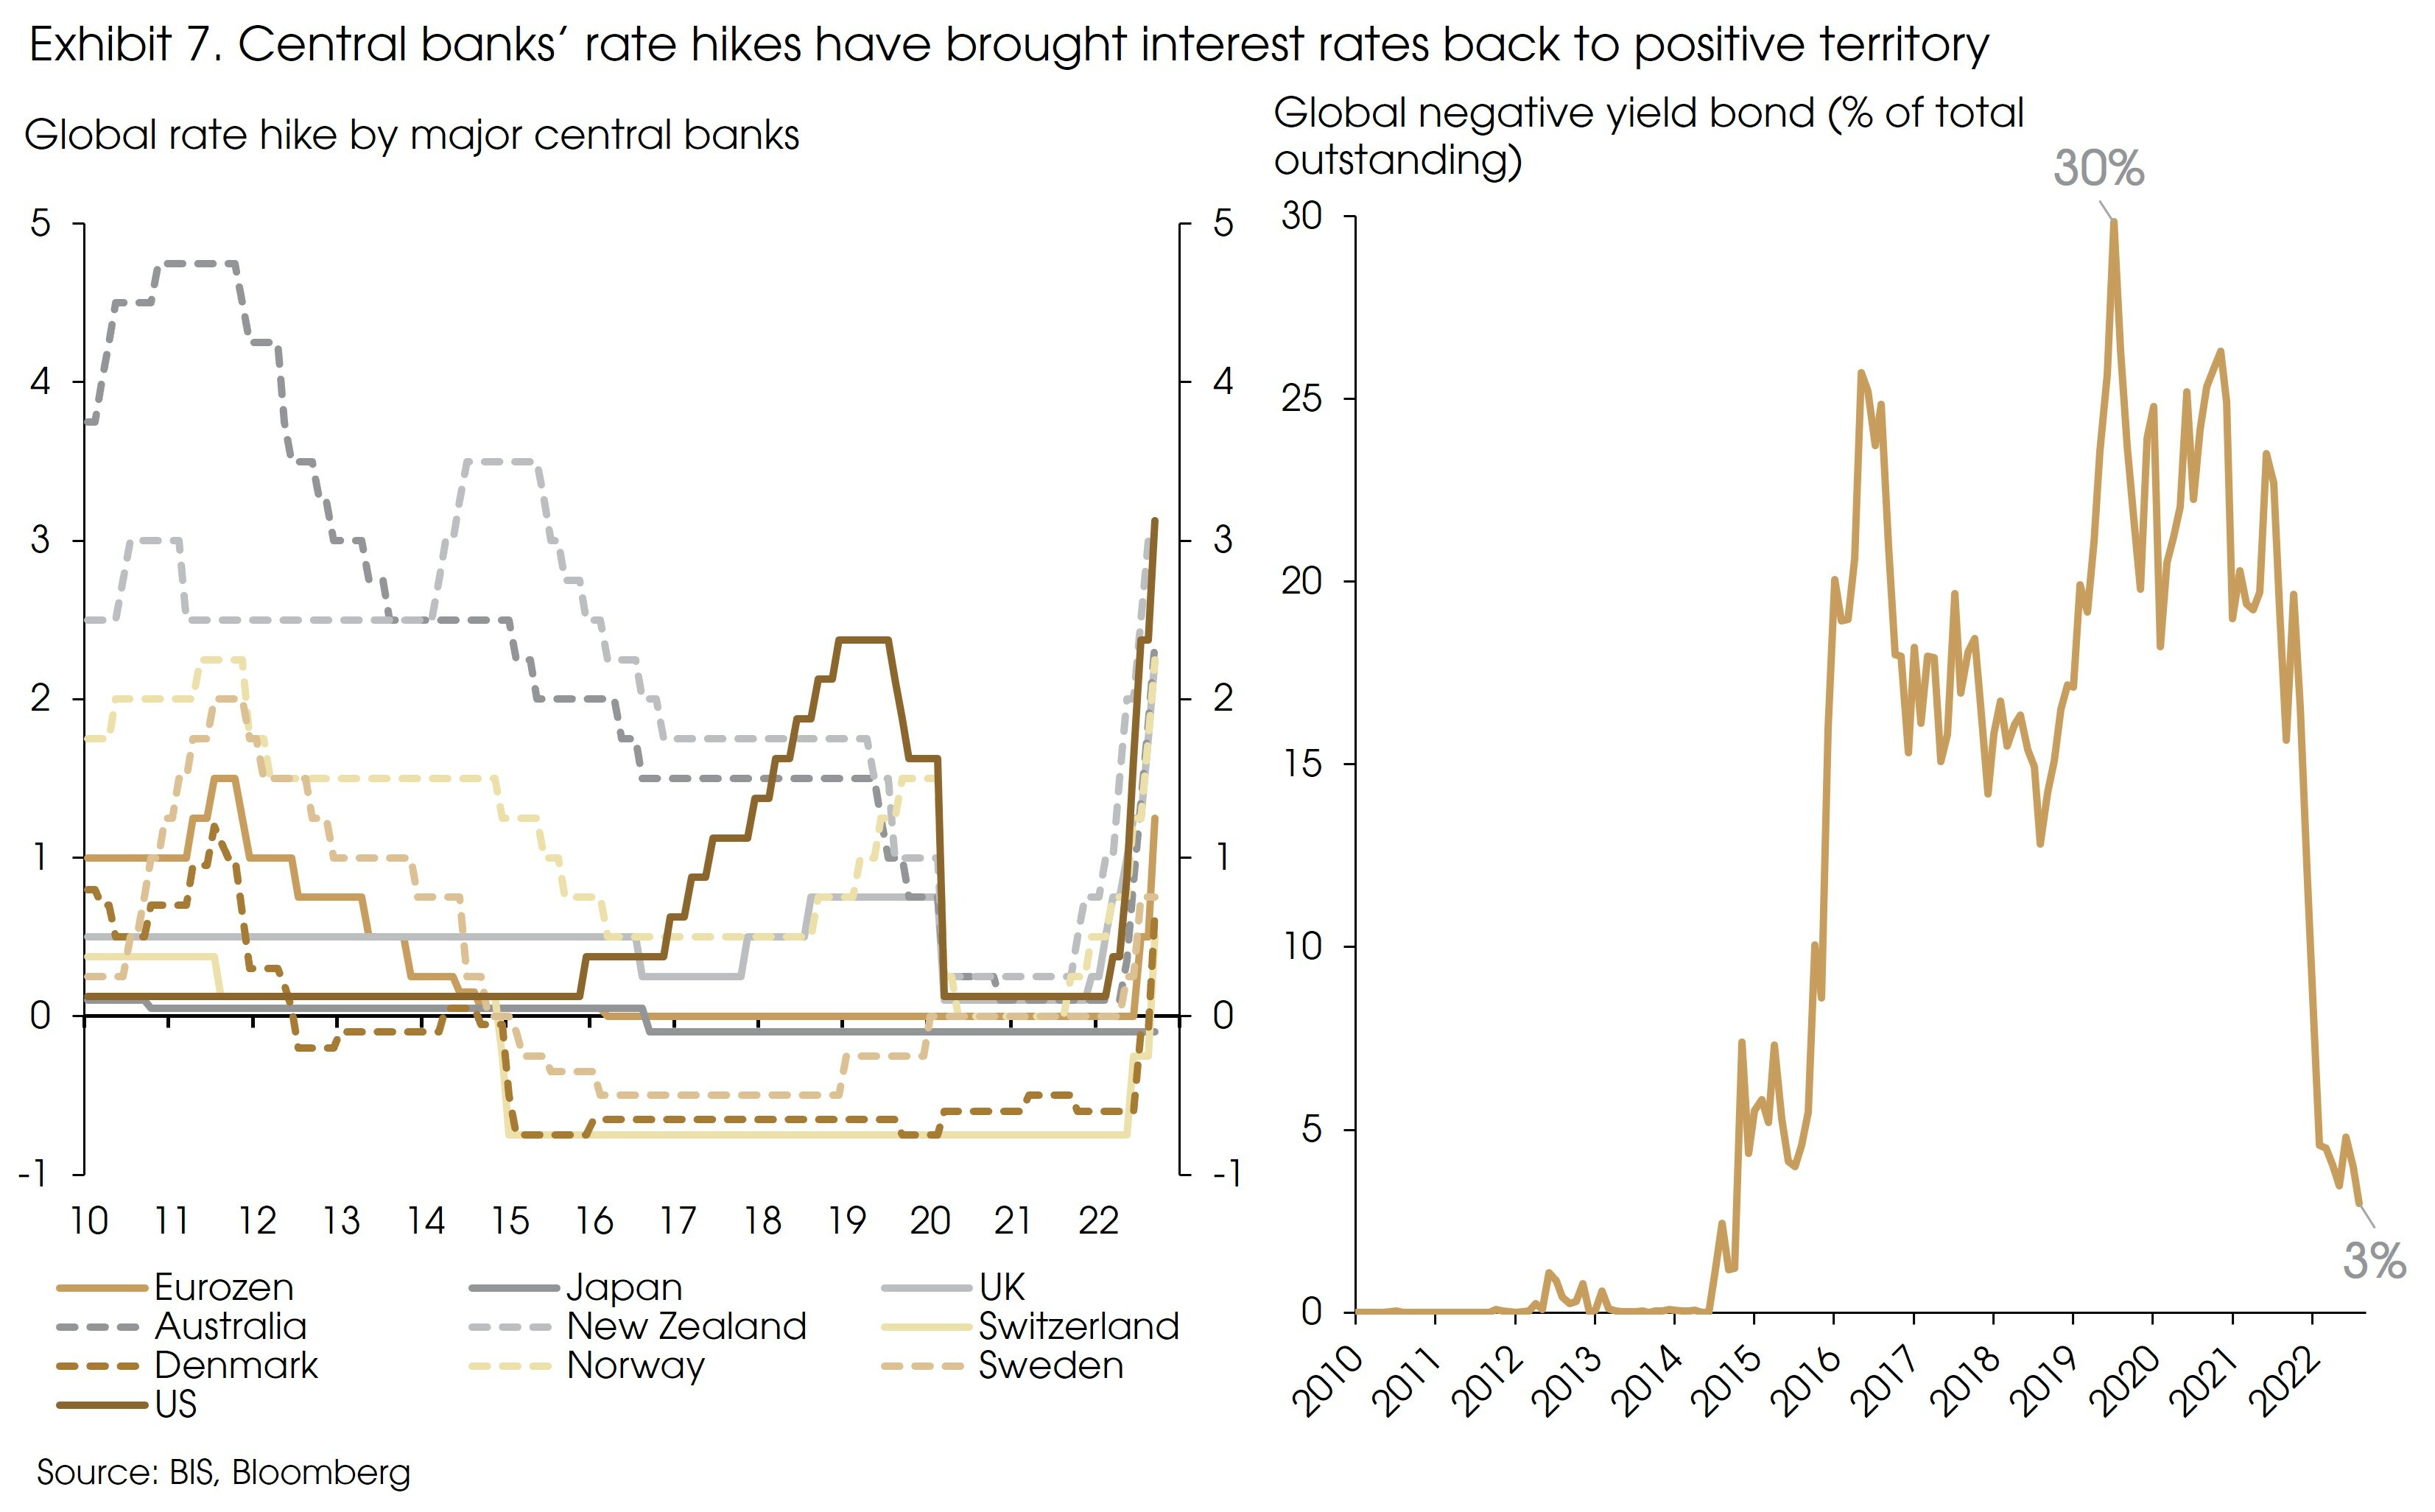
Most major central banks have brought their policy rates back into positive territory, ending the near decade-long zero/negative interest rate era (Exhibit 7). The share of negative-yield bonds increased from about 0% in 2010 to 30% in 2019 due to the NIRP (negative interest rate policy) in a number of countries and the “ever lower interest rates”. Currently, this share fell back sharply to 3%.
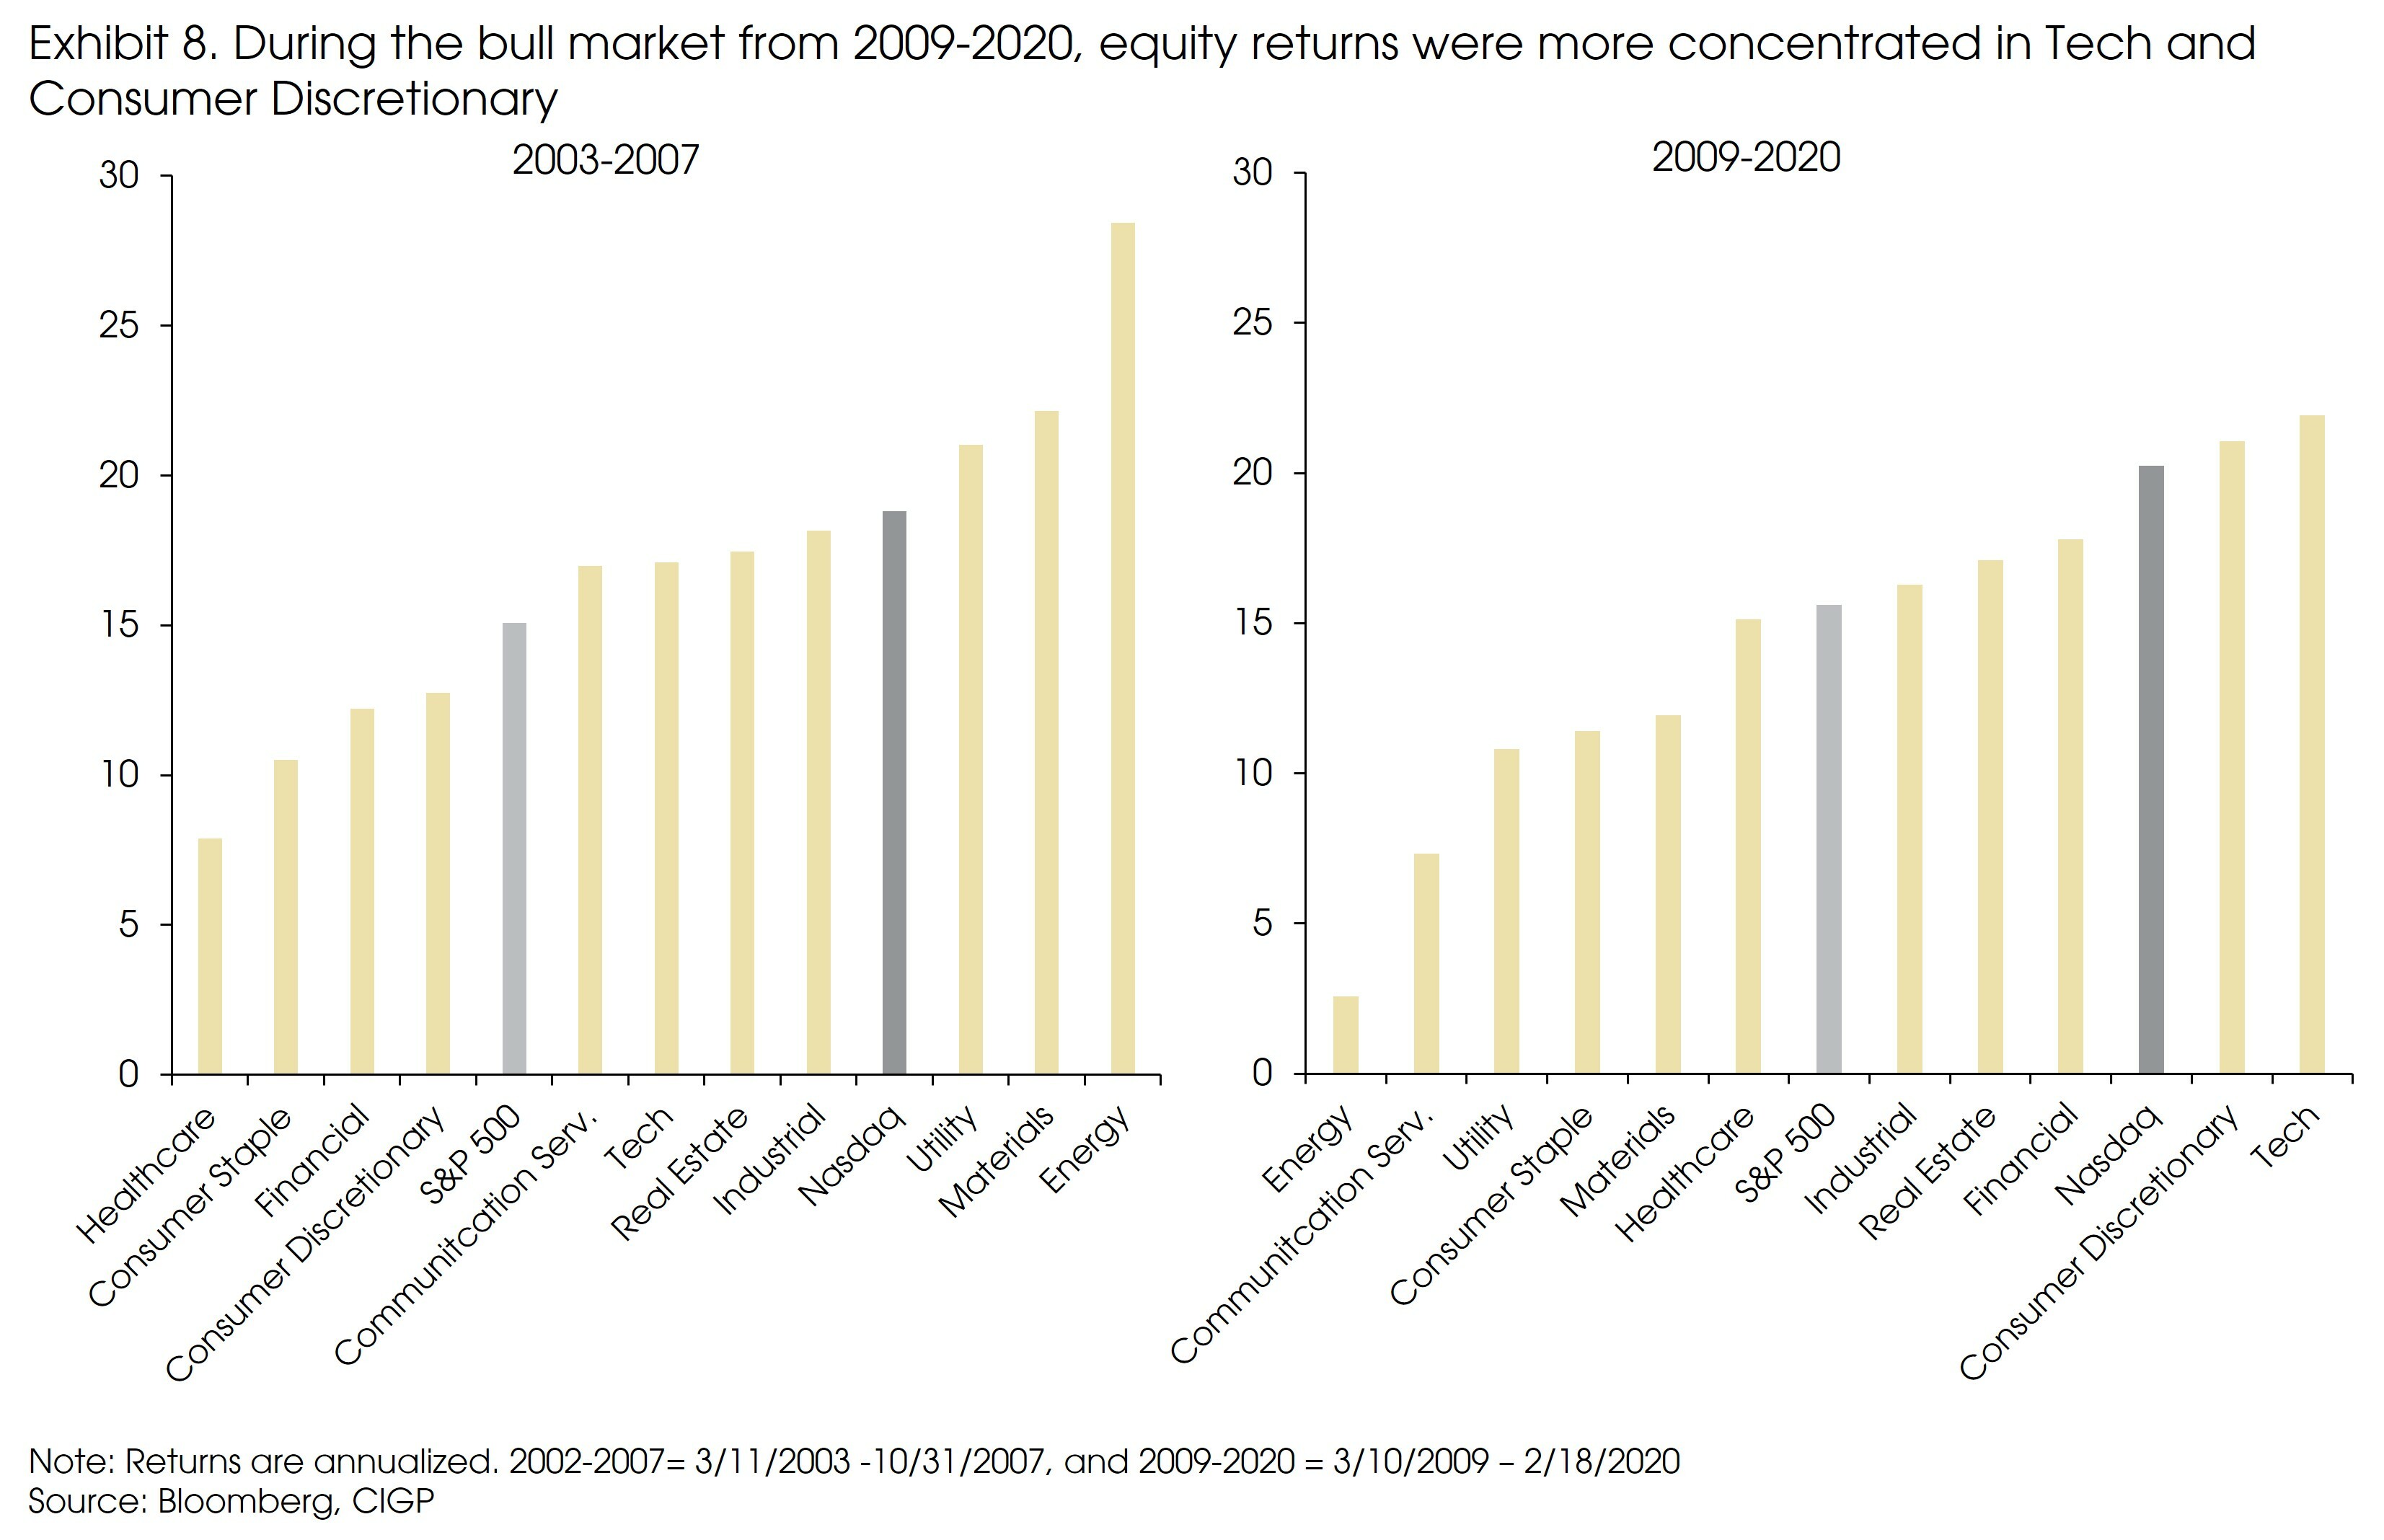
During the 2009-2020 bull market, the low interest rate environment led to a high dispersion in performances across sectors. Long-duration stocks (or growth names) significantly outperformed, and stock returns were more concentrated than the previous bull market (in Tech and Consumer Discretionary sectors, Exhibit 8). Meanwhile the mature industries were out of favour. Sector rotation has been brief, and sticking with the growth sectors was better rewarded than picking the best performing names within each sector.
For the next bull market, however, higher interest rates should indicate less room for valuation expansion as a driver of returns, constraining the huge outperformance of growth names seen in the past decade.
Other than the higher interest rates, input costs have also increased notably. Given the complicated geopolitical backdrop, we may see a possible relocation of global supply chains (especially for some industries) and a potentially higher cost of labor and energy.
The last bull market highly rewarded future growth potentials (even in loss-making companies). The focus on margin and cash flow sustainability is now likely to increase given the potentially rising costs.
Despite possible changes in the macro environment, future market leaders should still be the ones that can consistently generate long-term growth.
We thus still have high convictions in our Megatrends (see more details here), as we continue to see long-term growth opportunities from these areas even under changing macro backdrops.
For example, disruptive innovations are reshaping industries and creating new growth engines in sectors to generate new revenues. Significant growth opportunities are seen in 5G, Big Data, Artificial Intelligence/Robotics, Cybersecurity, Clean Energy Tech, BioTech, and AgriTech.
We also see attractive investment opportunities in some mature sectors going forward. For example, along with the energy transition, demand for some metals should rise too. Besides, alongside the aging population, a focus on healthier lifestyles is likely to mould the shape of many things from consumer products and services. Many such opportunities are in the healthcare industry (See Demographics - Is the World Getting Older?).
Finally, for some companies in traditional industries, even with a disruptive trend and new entrants (for example, EVs and e-commerce platforms), some players can successfully adapt by changing their business models and finding new revenue streams, e.g., some auto, energy, and utilities companies.
Consequently, investors should stick to the long-term growth themes in the next bull market. When looking at the ever-changing macro backdrop, one can focus more on Alpha (stock picking) rather than on Beta (market, sector, or style returns) opportunities and consider enhancing diversification (as returns should be less concentrated and sector rotation may last longer than in the past decade).
Sources: BIS, Bloomberg, CEIC, NBER, CIGP Estimates


