CIO Viewpoint: Another Year for Emerging Markets to Outperform?

Cyclical Tailwind from the Synchronized Recovery
Economic growth in emerging markets are expected to have a notable rebound from the recession last year.
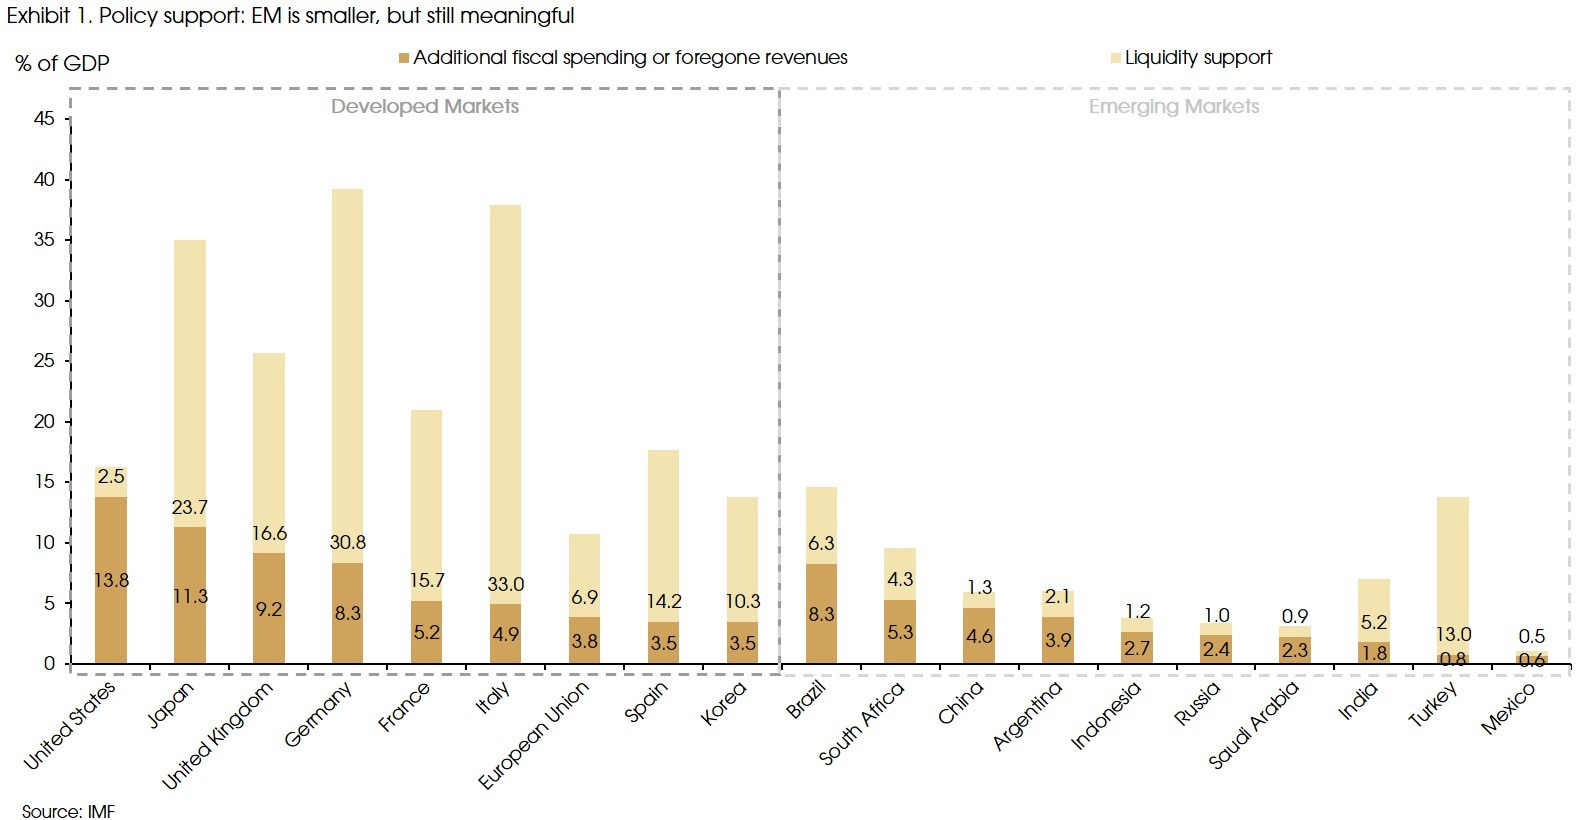
Large scales of monetary and fiscal stimulus from major developed countries led to a favourable liquidity condition and a weakening dollar. This enabled emerging market (EM) countries to also provide their own meaningful liquidity and fiscal support (Exhibit 1). These all helped prevent worse outcomes in EM countries: there have been no debt crisis or significant sovereign risks in emerging markets yet.
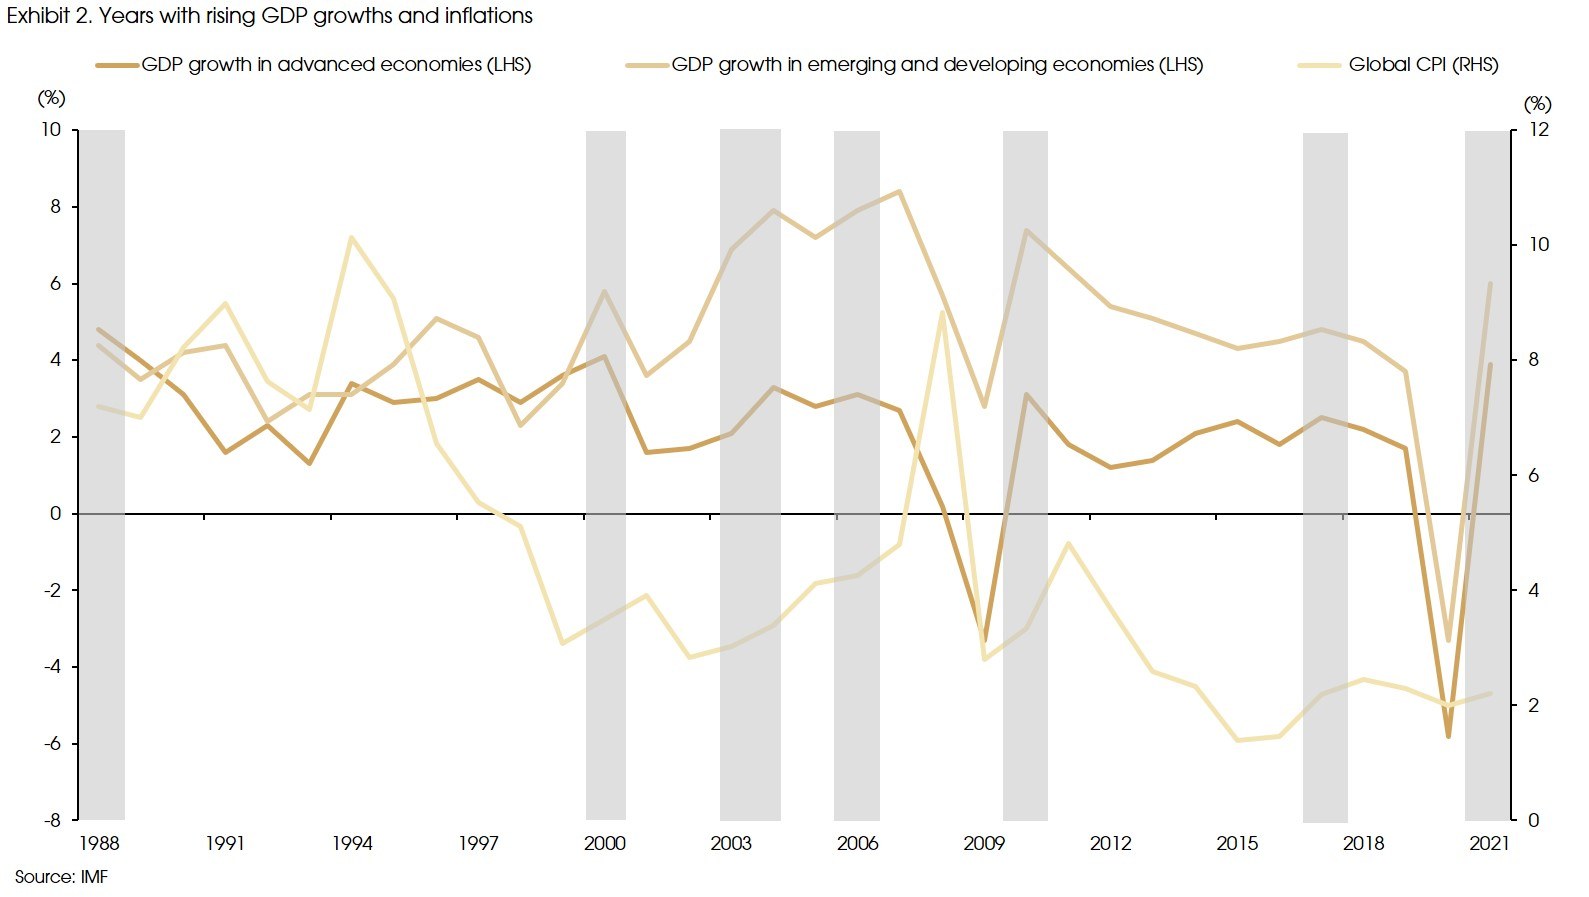
Given such a backdrop, and the improving pandemic condition, the gradual vaccine roll-out, as well as the expected quick rebound of demand from developed economies, the emerging markets' GDP is estimated to bottom out from -3.3% in 2020 to 6% in 2021. EM assets will benefit from the synchronized global recovery.
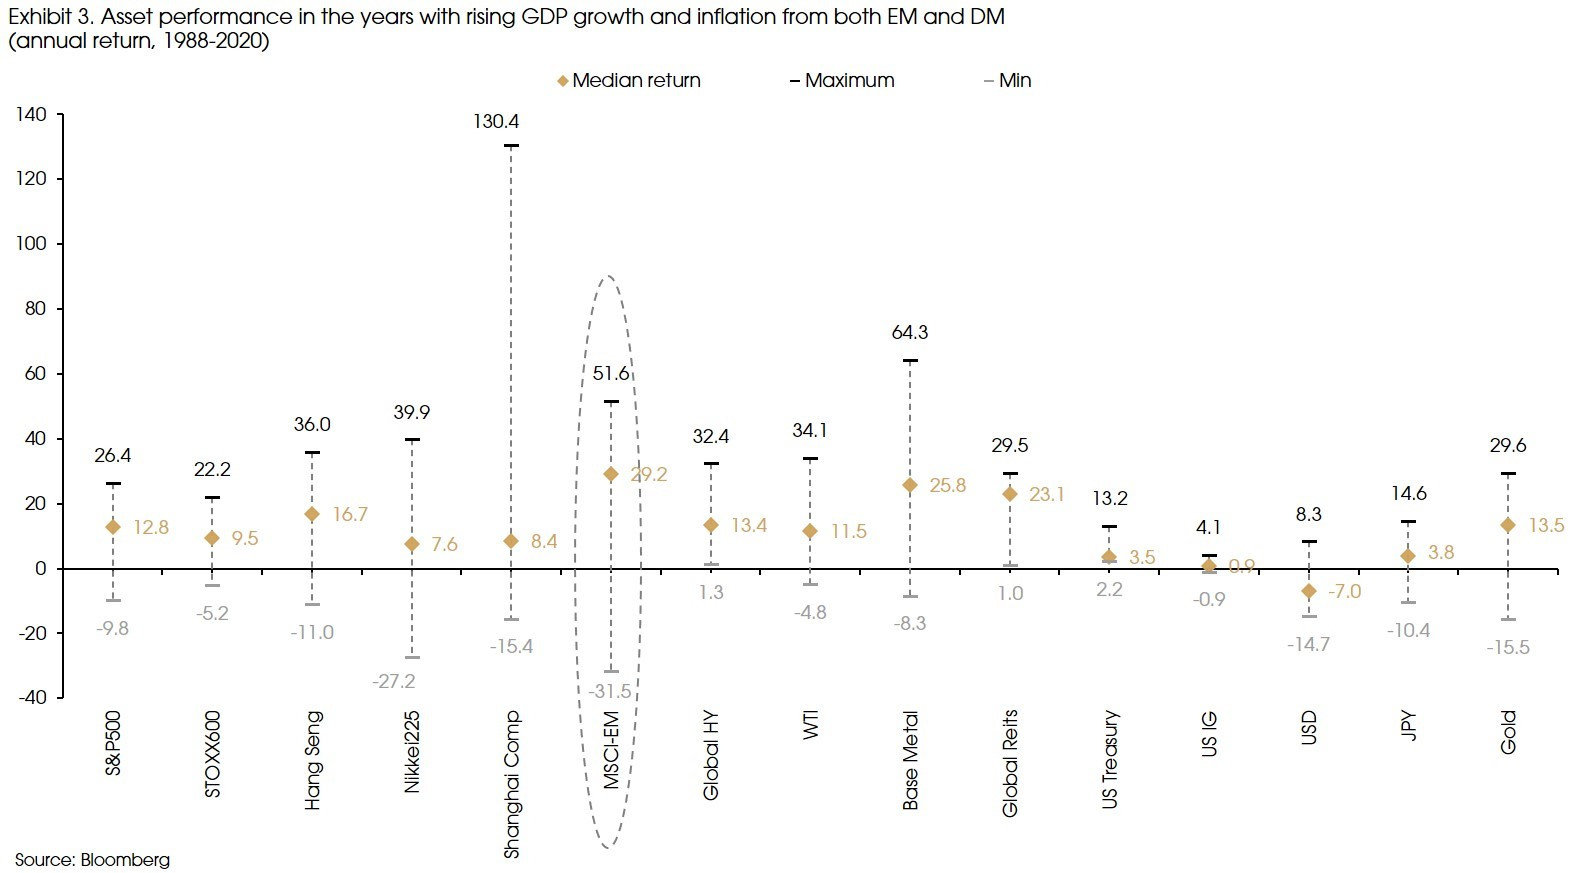
Historically, during the years when emerging markets and developed markets both had rising GDP growths and rising inflations (which is expected to be the case this year), EM equities almost always had notable gains and outperformed other assets (Exhibit 2 and 3). The only exception was the year 2000, when the US tech bubble burst, EM equities were severely hit, and the MSCI-EM index was down by -31.5%.
Therefore, a possible replay of the history suggests that EM equities may have another year of better performance in 2021.
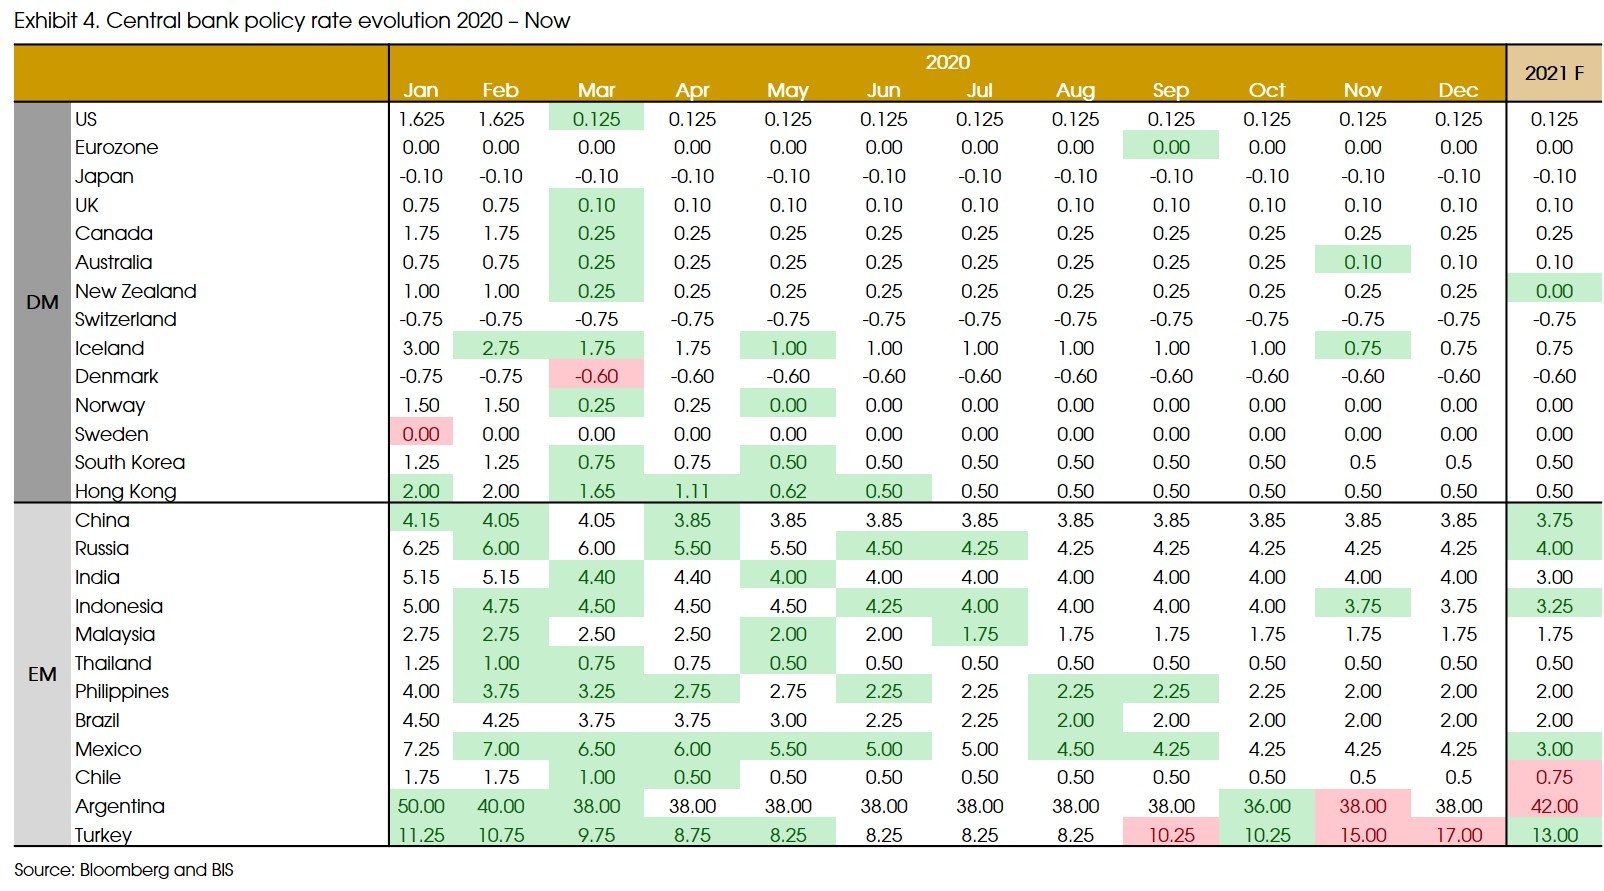
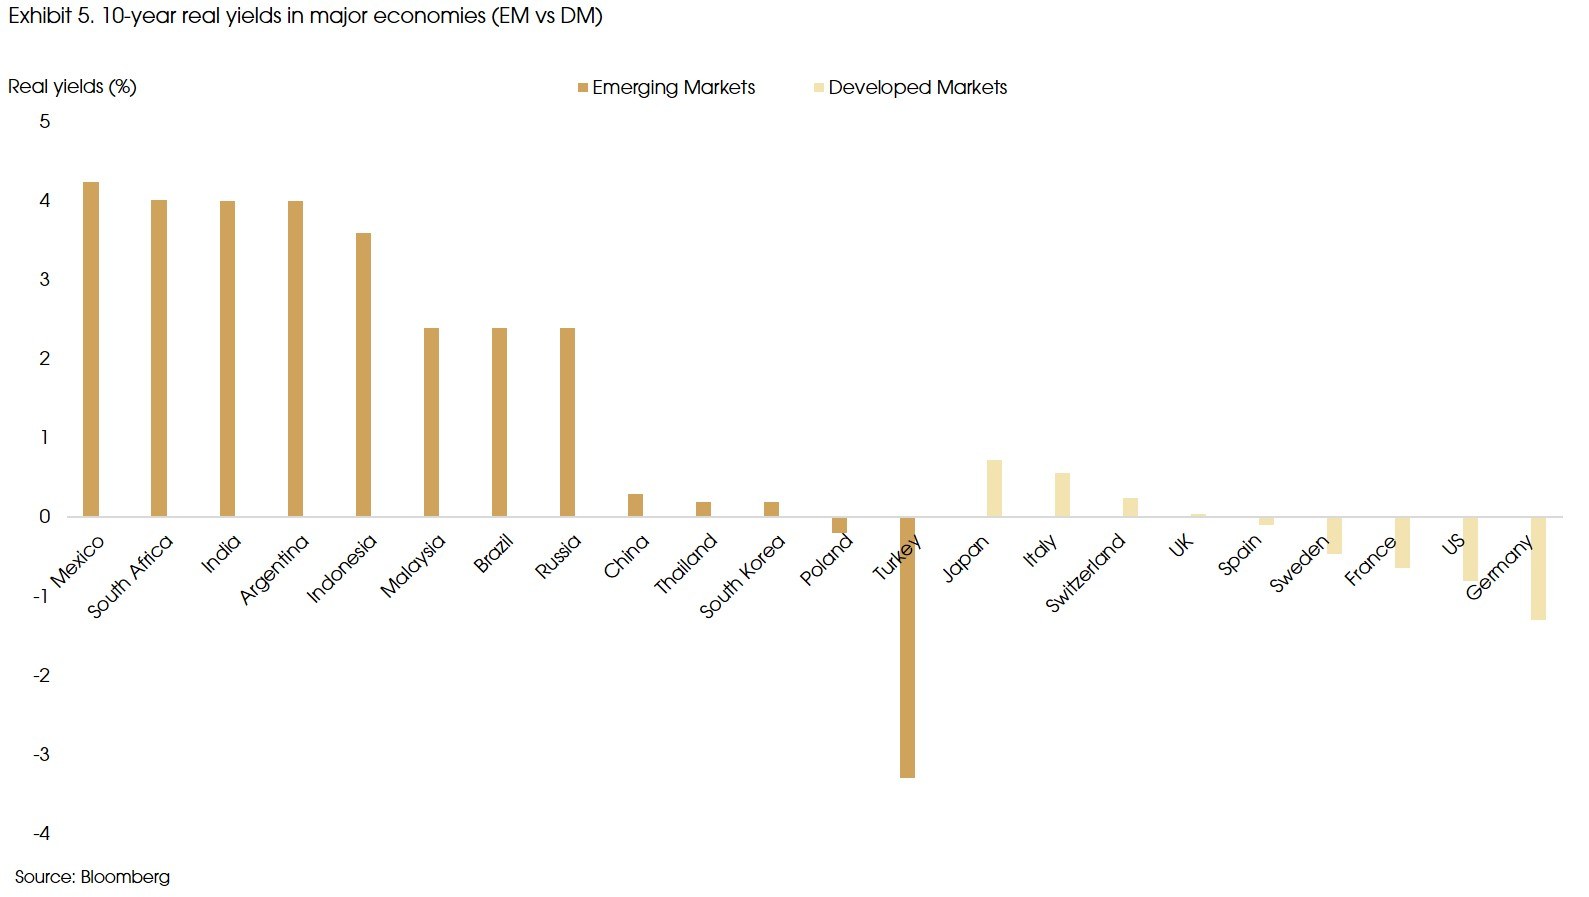
For fixed income, emerging markets also have considerable yield advantages compared with developed markets. Most EM central banks cut the policy rates to support the economies last year. However, the benchmark interests are still much higher in emerging markets (Exhibit 4). Therefore, real interest rates in most emerging markets are still positive and can be as high as 4% in some countries, while real yields in developed markets are mostly zero or negative (Exhibit 5).
Given the continued easing stance from developed markets, there are still rooms at least for some EM countries to further cut the rates. For example, market consense shows that central banks in China, Russia, Indonesia, and Mexico may conduct further rate cuts this year (Exhibit 4).
Therefore, the cyclical tailwind from the recovery and favorable monetary policy may play a key role in supporting EM assets this year.
A Potential Boost from Commodities Rebound
The Commodity Research Bureau Futures Price Index has rebounded by more than 50% from last year’s lows in April. The supply-side shock brought by the pandemic and the recovery in global demand since the second half of last year were the main drivers for rising commodities prices. Looking forward, this cyclical rising trend in commodity prices may continue in the near future, given the potential rebound in capital investment, the cutback in supply and capacity, and possible supports from fiscal policies.
First, global economic recovery will probably lead to a cyclical surge in capital expenditure this year. Due to the pandemic-led lockdown, global capital investment collapsed last year, which set the stage for a substantial rebound as businesses rebuild their capital base. Besides, low interests (or borrowing costs) would encourage capital investment.
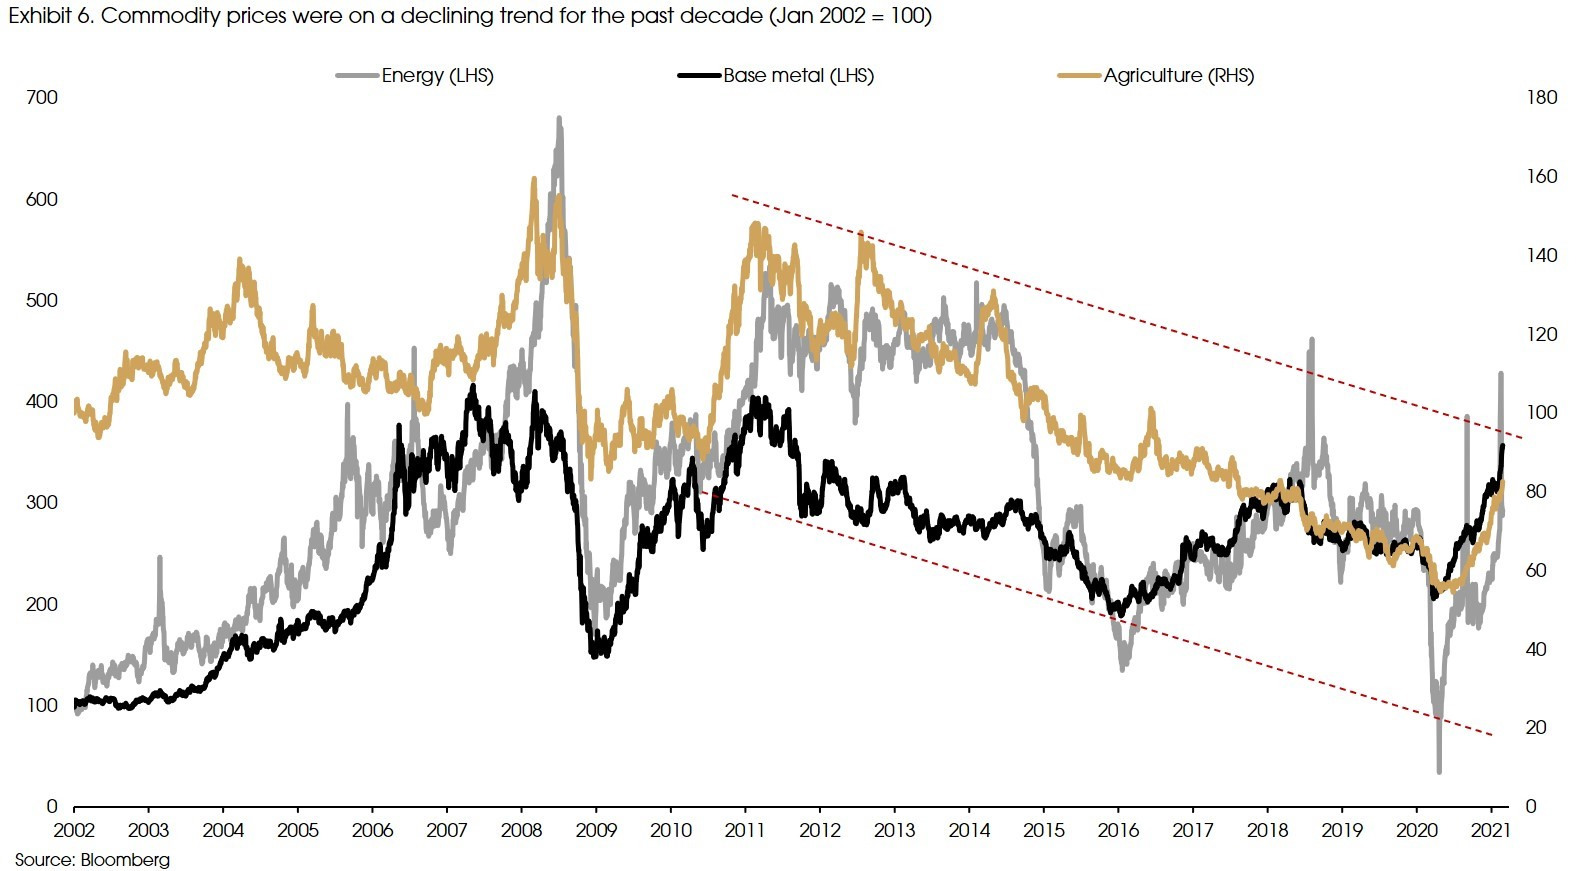
Second, there are notable signs of cutbacks in capacity alongside the declining commodity prices during the past decade (Exhibit 6). Such an impact on supply is more pronounced in the mining sector. Unlike the energy sector, there have been few major productivity breakthroughs in the base metal mining sector over the past two decades. Therefore, marginal output has to be achieved by increasing cost. As a result, capital spending in the global mining sector fell significantly. For example, Australia's investment in iron ore exploration is down by 75% from its 2012 peak, while iron ore inventories in China are still contracting.
Moreover, going forward, fiscal policy will likely shift from supporting the households to rebuilding the economy, which foreshadows more infrastructure expenditures and, thereby, increased demand for commodities. The US infrastructure investment plan has bipartisan support. Meanwhile, China’s capital expenditure in road construction has already picked up.
Therefore, the supply shortage and the demand rebound should continue to support commodity prices this year, and the supply-demand mismatches in some market can even take years to digest (for example, base metals), suggesting significant upward pressures on prices.
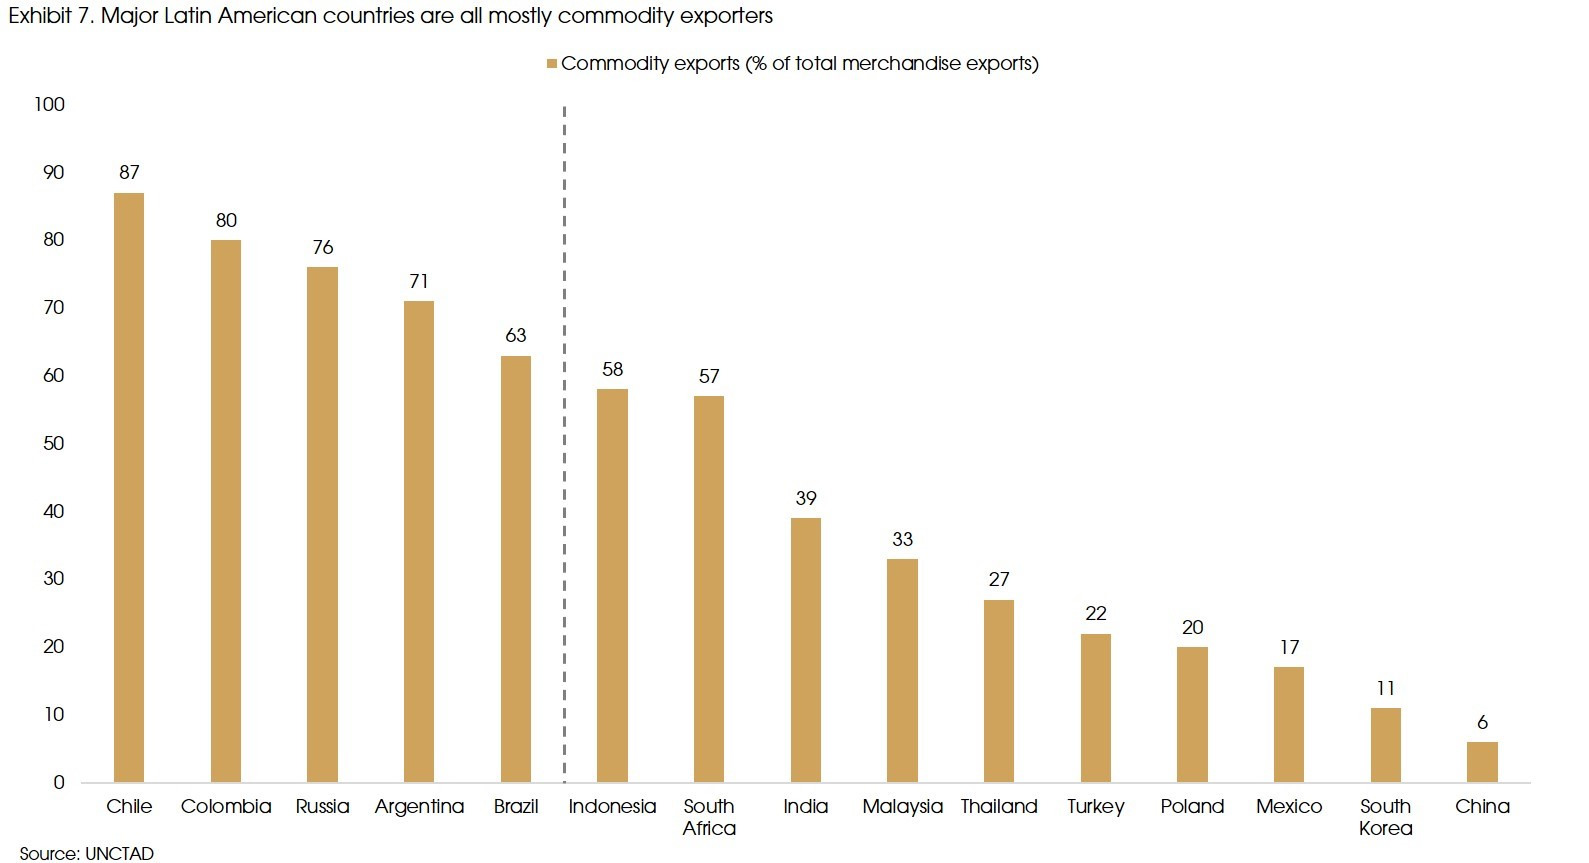
Such a commodity “bull market” may benefit commodity-exporting countries’ assets. According to United Nations Conference on Trade and Development (UNCTAD), one country is considered to be export-commodity-dependent (or considered as a commodity-exporting country) if more than 60% of its total merchandise exports are composed of commodities. Among major emerging economies, most Latin American countries are commodity-exporting countries (Exhibit 7). Their equity markets generally performed better during the commodity “bull markets”, such as from 2000 to 2008, and from 2010 to 2013 (Exhibit 8).
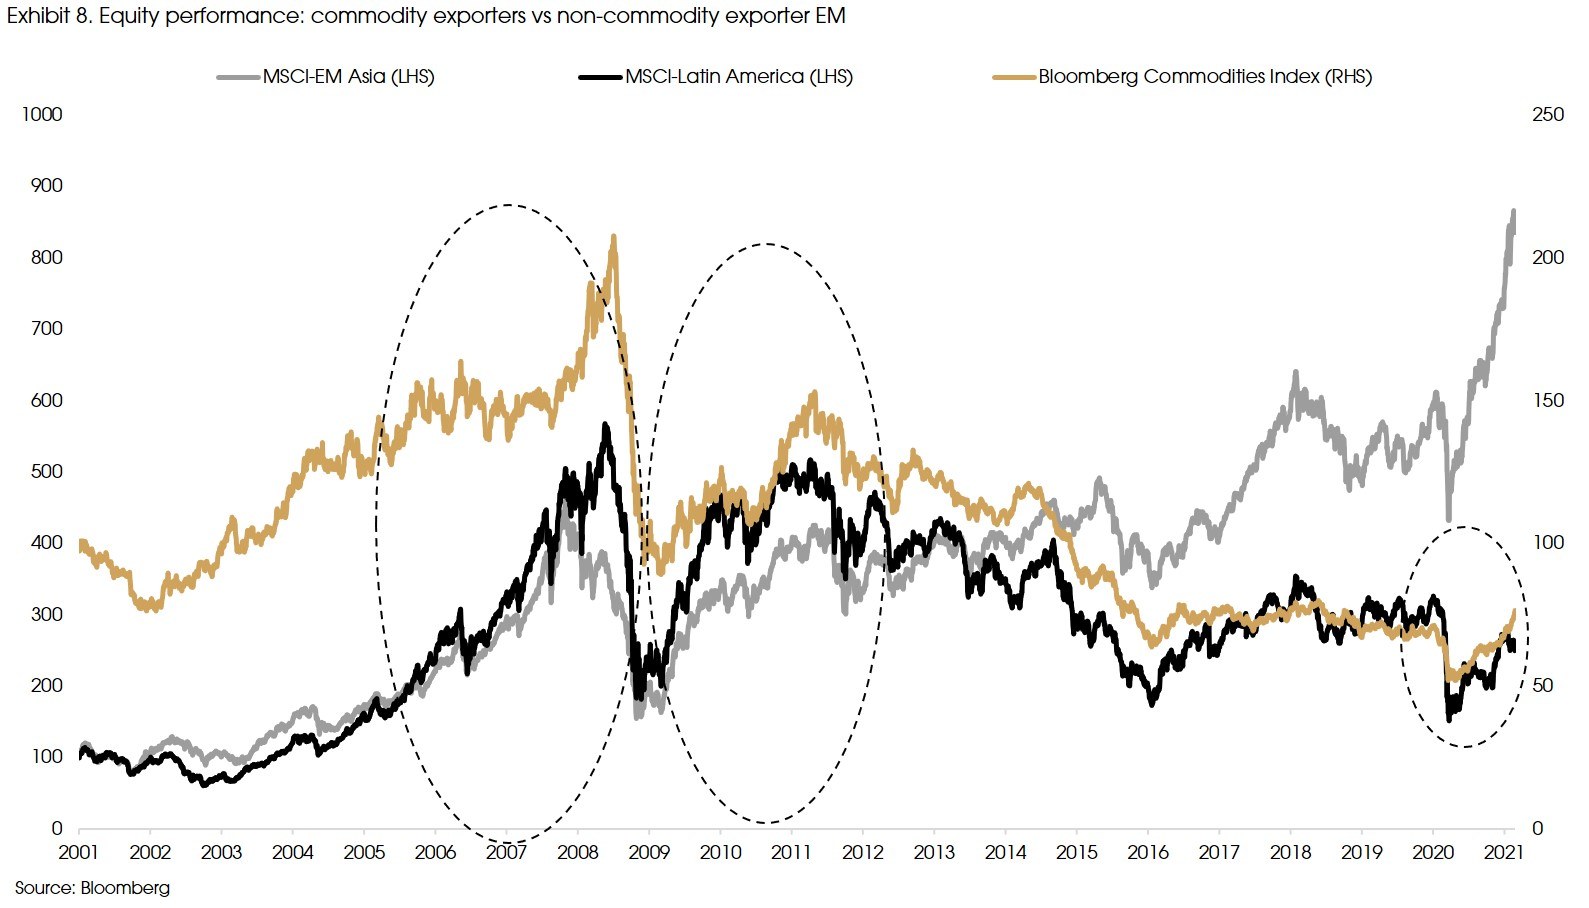
As commodity prices rebounded since last year, most commodity‑exporting country’s equity markets also bottomed out. Given the fact that these markets are still lagged behind other markets, for example, developed markets and emerging Asia, it may suggest potential “catch-up” opportunities.
Beyond the Cyclical Run: Risks are Still Notable
That said, risks regarding emerging markets are still significant, especially given the rising interest rates. The US’s large scale of fiscal stimulus has boosted growth outlook and drove up inflation expectations, which leads to a quick rise in interest rates, thereby raising widespread concern over an early exit from the Fed’s easing policy.
Unfavorable external conditions (i.e., quick rises of interest rates, a stronger dollar, and liquidity tightening) always exert downward pressures on EM assets, especially the fragile ones.
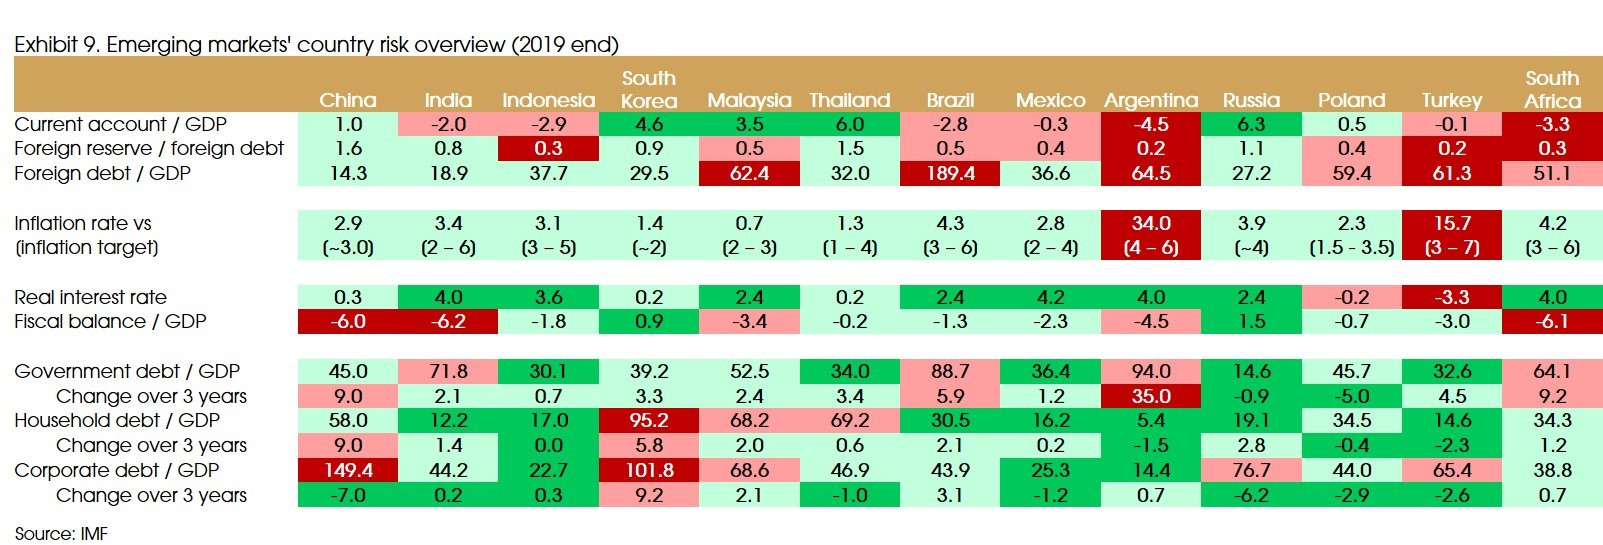
Countries that are with twin deficits (on both current and fiscal account), high external debts (usually, countries with external debt to GDP ratio higher than 60% can be considered as risky), and insufficient foreign reserves are more fragile to external shocks.
Back in 1997-1998, the Asian Financial Crisis was exactly a result of external shock and internal fragility. Southeast Asian countries enjoyed fast growth from 1980 to 1990. However, such momentum started to moderate since the early 1990s. Moreover, current account deficit and fiscal deficit -- which were financed by dollar-denominated external debt -- significantly increased in countries such as Thailand, Indonesia, Philippines and Malaysia. Thailand’s currency peg to US dollar made such balance-of-payment distortion even more unstable.
As a result, George Soros’s currency speculation strategy broke the Thai Baht-USD peg, triggering huge capital flight out of Asia, resulting in the region's severe financial and economic crisis.
However, after the financial crisis, Asian countries have adopted rounds of reforms, aspiring to become manufacturers and exporters of higher value-added products, even high-tech products. Such a change helped them accumulate higher foreign exchange reserves from trade surplus, becoming more "self-sufficient" in capital, and thereby more resilient to external shocks.
On the other hand, commodity-exporting countries are more vulnerable to commodity price fluctuations and external demand shocks. Therefore, they tend to have larger current account deficit and solvency risks (i.e., high external debt and low foreign reserves). Specifically, Latin American countries, Turkey and South Africa are now the more fragile ones, compared with the other emerging countries (Exhibit 9), and will be under more pressure if the liquidity condition tightens.
Specifically, during the 2013 “taper tantrum” (when the Fed indicated reducing its QE purchases), the more fragile Latin American assets experienced a harder hit compared with the emerging Asian assets (Exhibit 8).
That said, compared with 2013, we think that the risks from rising interest rates should be milder for now, and we do not expect to see another “taper tantrum” this year.
First, the Fed has repeatedly addressed that it will maintain the “lower for longer” stance on policy rate (no rate hikes). Therefore, even though the Fed talks about QE tapering as early as 2Q this year, if the fiscal support and vaccine are smoothly rolled out and the economy recovers strongly, the upward pressure on interest rates should be milder.
Moreover, in 2013 the dollar was undervalued and the commodity market was at the end of a rising trend. While currently, the dollar is likely to sustain its weakening trend, while commodity prices will continue to rebound, which will both support EM assets.
More importantly, there is a notable change in EM equity universe. Commodity-exporting and more fragile EM countries now only account for less than 20% of the total EM market cap, while the share of more solid ones, such as emerging Asia, increased from less than 50% to 80%.
Besides, foreign investors were more optimistic in EM assets back in 2013. Therefore, foreign holdings in EM equity and bonds were much higher than that in the recent years.
Thus, lower foreign position and the changing market structure suggest that EM assets will not necessarily suffer a lot even when a rising interest rate and a stronger dollar break the cyclical tailwind and limit the downside of the market.
Nonetheless, other risks to EM assets include: 1) a slower than expected vaccination process, which may affect the expected economic recovery; 2) political risks such as the market selloff in Argentina after the 2019 election and the 2018 crisis in Turkey triggered by its president's claimed intervention in monetary policy.
Beyond the Cyclical Run: What Do We See in the Long-Term?
The cyclical tailwind is significant for emerging markets in the near term, but may only last for a year or two. Beyond short-term cycles, what is the long-term theme for emerging markets?
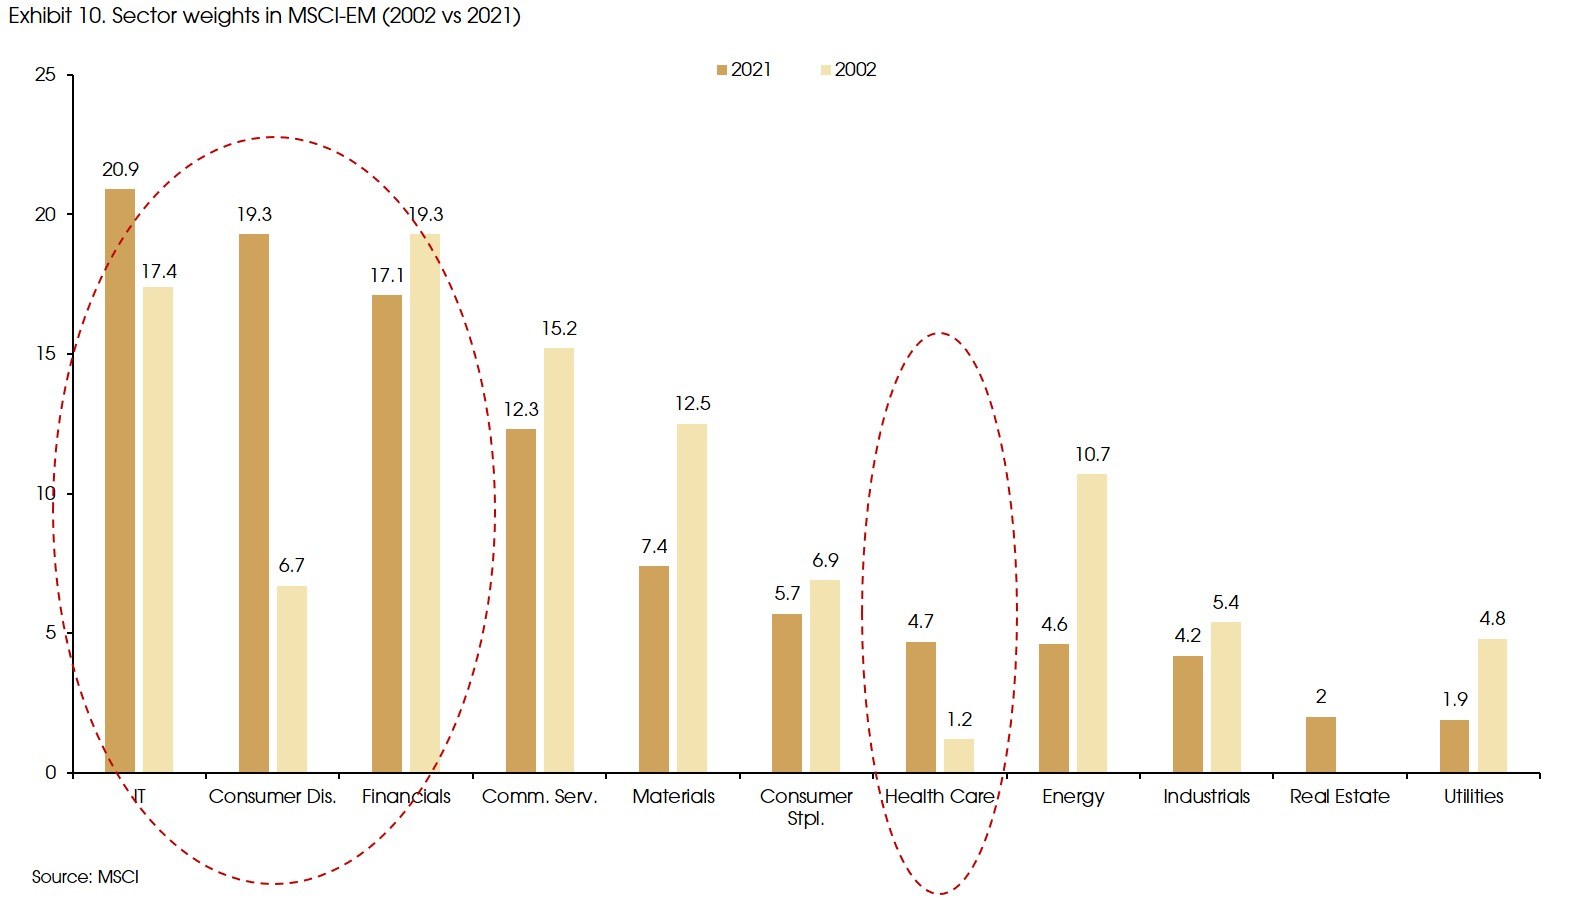
Changes in sectoral weights of the MSCI‑emerging‑market Index during the past two decades (Exhibit 10) suggest: 1) technology and financials maintained their substantive shares in EM equities; 2) shares of discretionary consumption and healthcare became significantly larger; 3) Other traditional and more cyclical sectors all became less important during the same period.
Such changes are generally in line with our megatrend themes on rising emerging market consumers and disruptive technologies (see CIO Viewpoint: Megatrends).
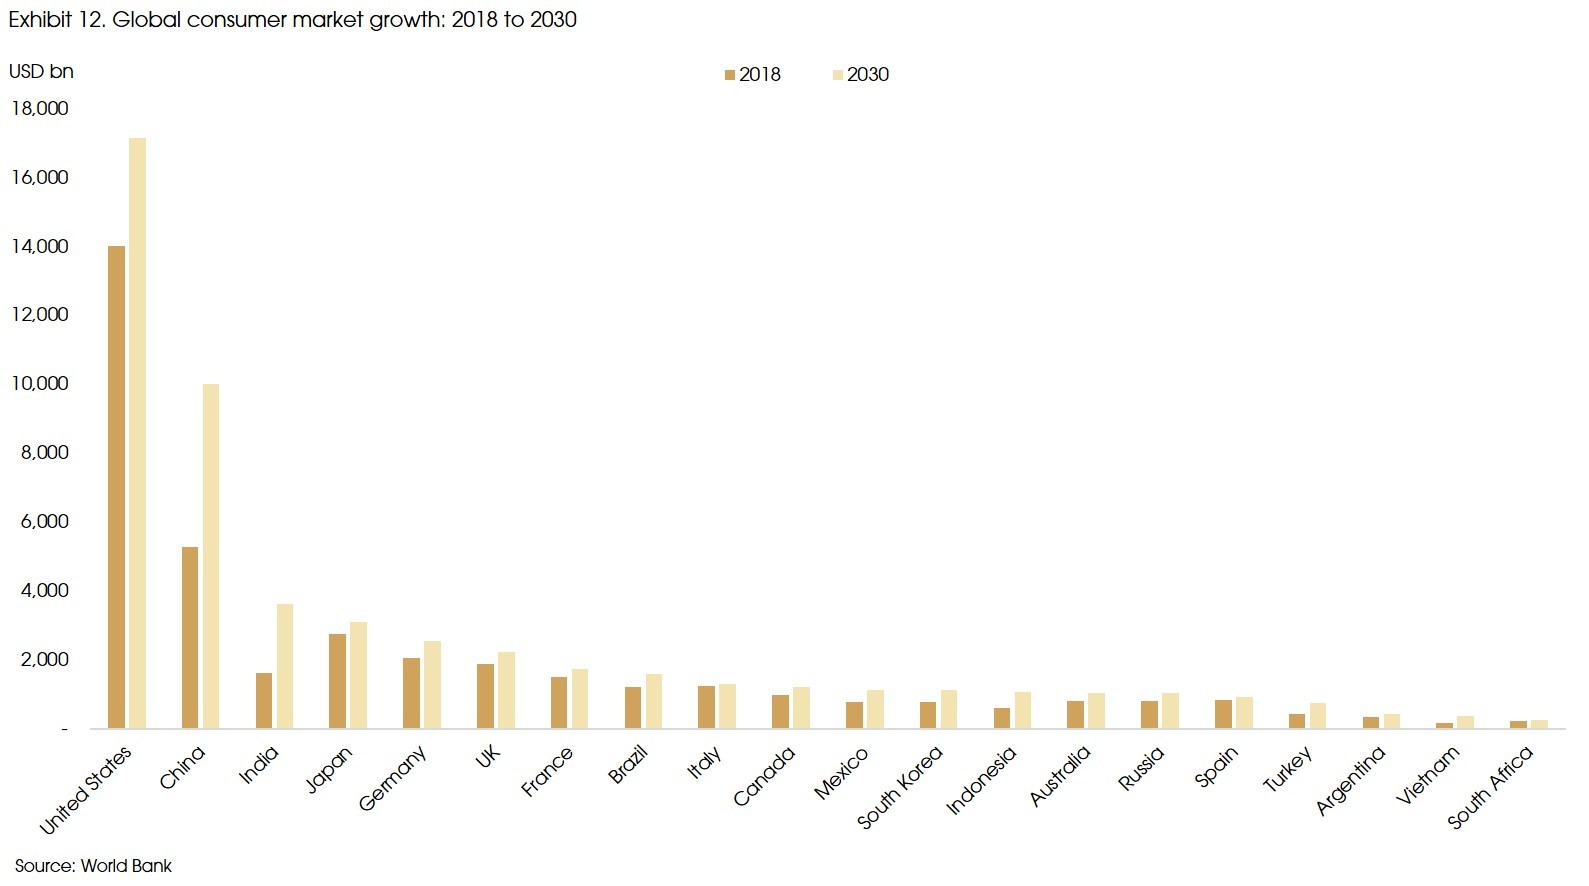
We expect the continued economic growth in emerging markets to support higher growth in individual income and consumption. Although the US may remain the largest consumer market in the next decade, higher growth will be witnessed in emerging markets, such as China, India, and Indonesia (Exhibit 11).
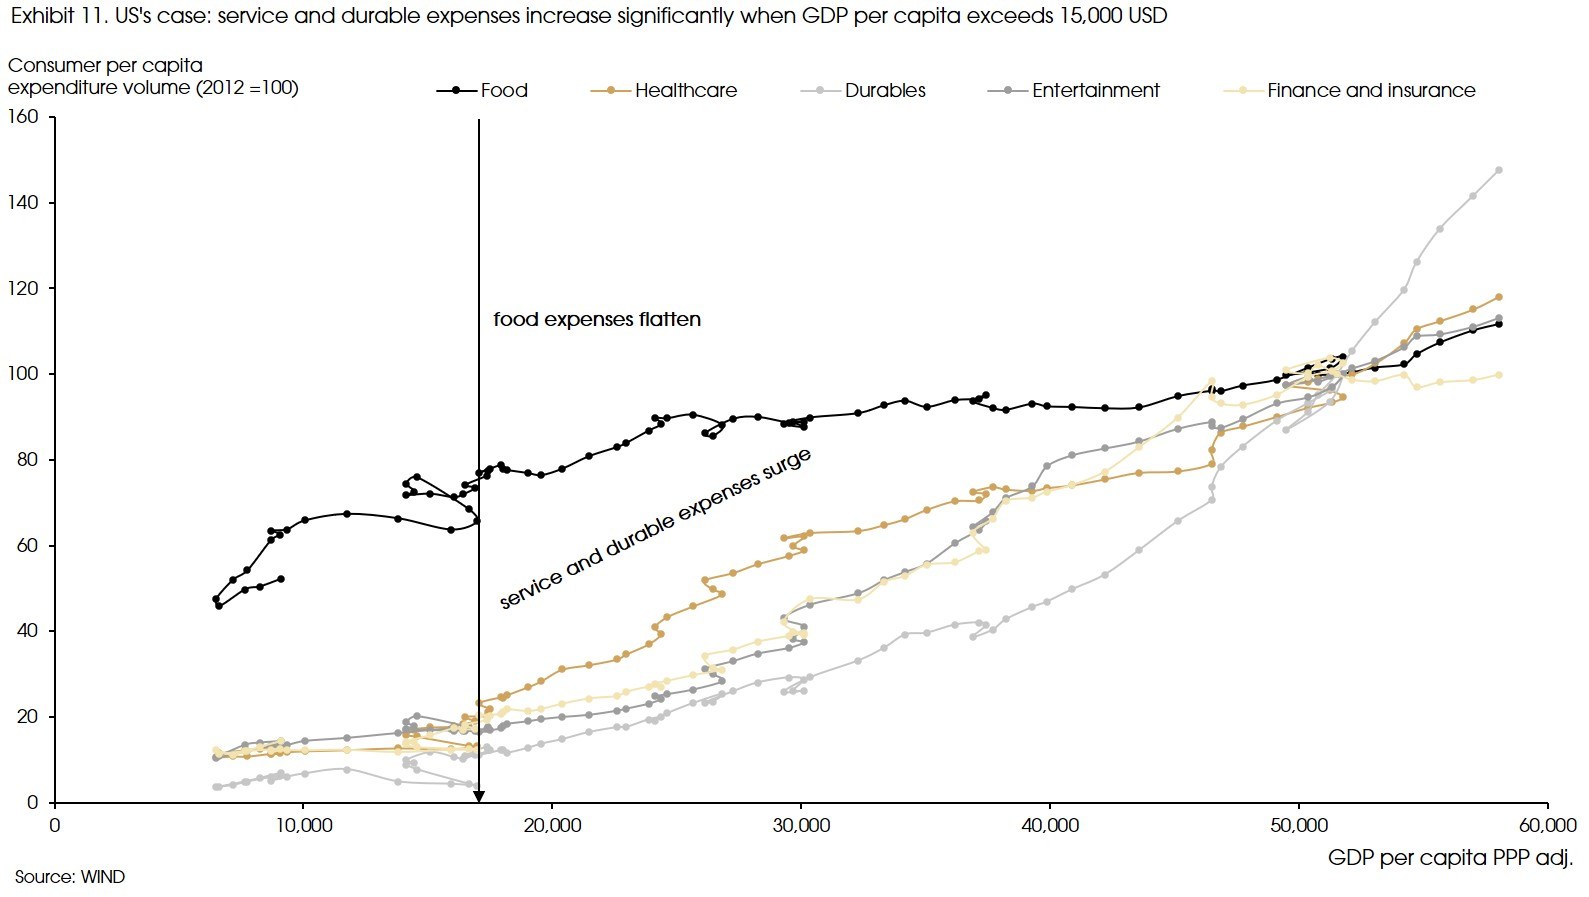
Moreover, given the experience of the US, as individual income continues to rise, emerging market consumers’ demand for durable goods, healthcare, entertainment, and financial services should increase at a higher pace (Exhibit 12).
Meanwhile, the pandemic has been motivating further and faster digital transition in emerging markets.
Therefore, in the long run, consumption and tech should remain our key focus when it comes to the emerging markets, and the combination of the two may have even stronger tailwinds, e.g., in e-commerce, online entertainment, fintech and telemedicine sectors etc.
Given such sectoral focus, our country/regional focus should remain the less “fragile” ones with more stable growth, higher potential in tech advancement, as well as a growing consumer market (for example, emerging Asia).
